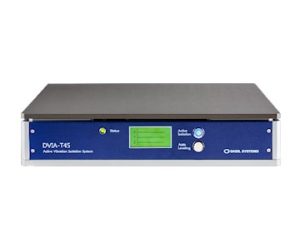
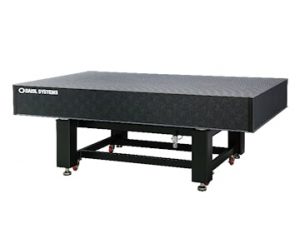
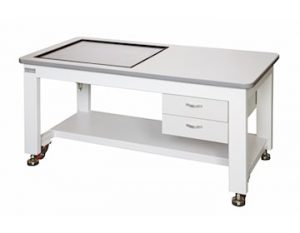
Active Vibration Isolation Systems
- PARK SYSTEM XE-100-01 AFM
- PERSONAL AFM
- AFM SILCON CANTILEVER IMAGING
- HOLOGRAPHINC MICROSCOPE
- 50nm RESOLUTION MICROSCOPE
- WHITE LIGHT INTERFEROMETER
- LIVE CELL IMAGING MICROSCOPE
- DOWNLOAD
- JEOL Tabletop SEM
PARK SYSTEM XE-100-01 AFM
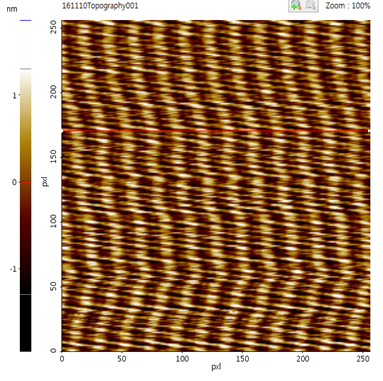
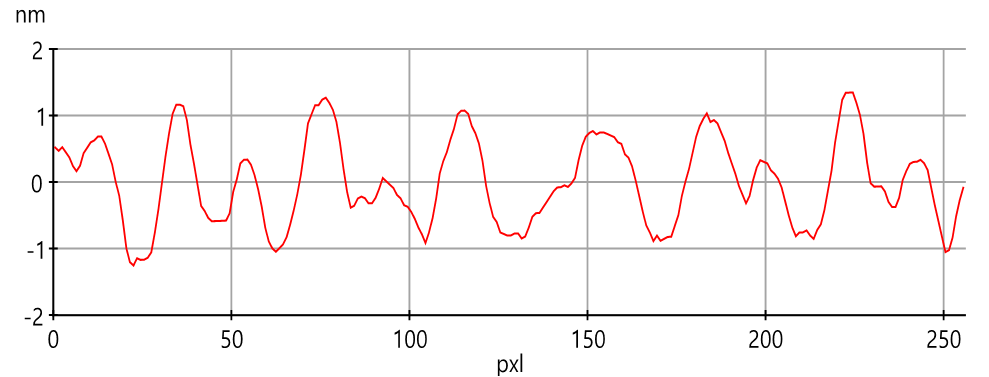
Pneumatic Vibration Isolation Table Set point : 502.34 (nN)


Active Vibration Isolation Table(DVIA-T45) Set point : 563.25 (nN)
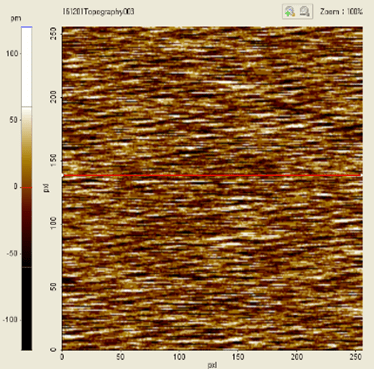
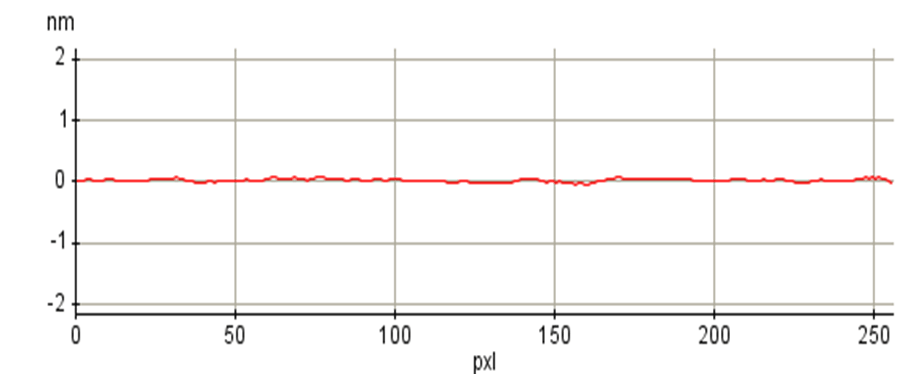


The line profile indicates that the nosie of the pneumatic vibration isolation tables is 10 times greater than the active vibration isolation table and the cause of exccessive noise of the XE-100-02 due to the vibration isolation performance difference between the pneumatic vibration isolation table and the active vibration isolation table. The AFM XE-100-01 confirms that it is possible to measure fine samples of the XE-100-02 with DAEIL SYSTEMS's tabletop active vibration isolation platform.
AFM
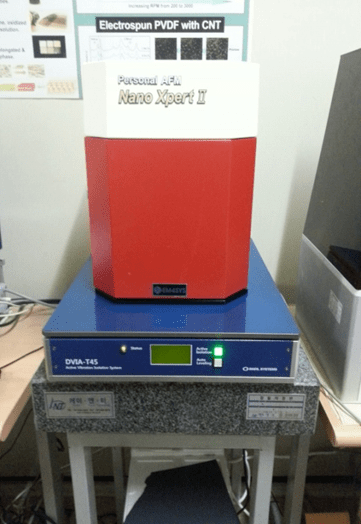
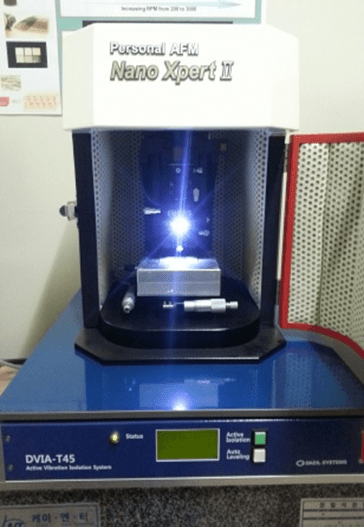
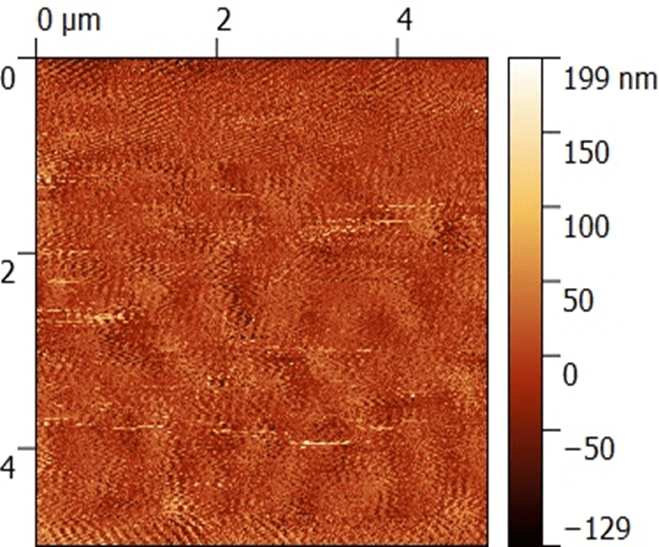
Active Vibration Isolation OFF
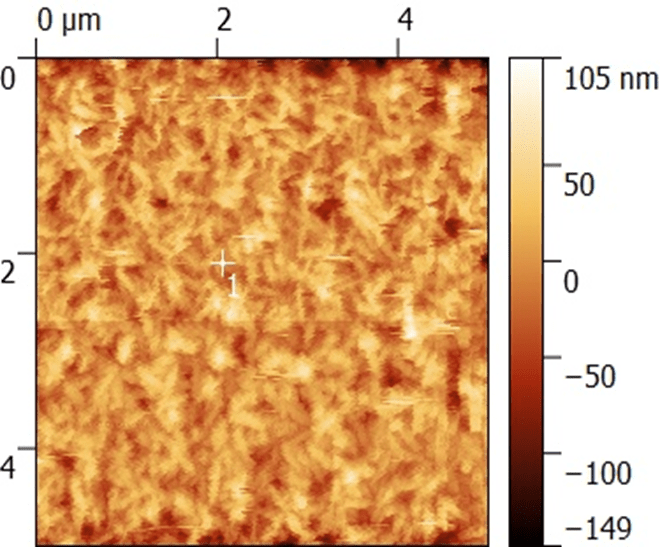
Active Vibration Isolation ON


Active Vibration Isolation OFF

Active Vibration Isolation ON
AFM SILCON CANTILEVER IMAGING
Analysis - frequency
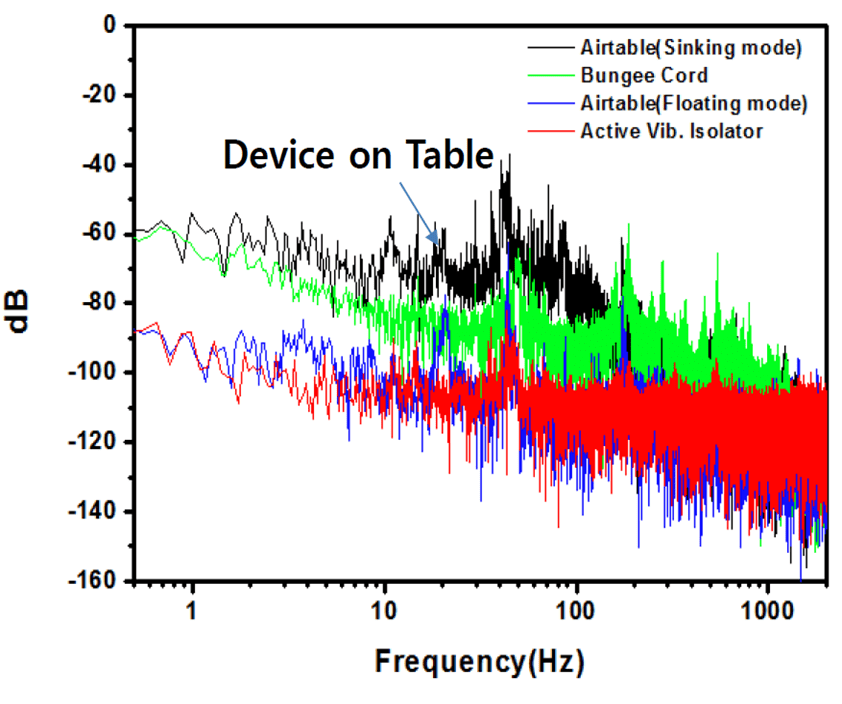
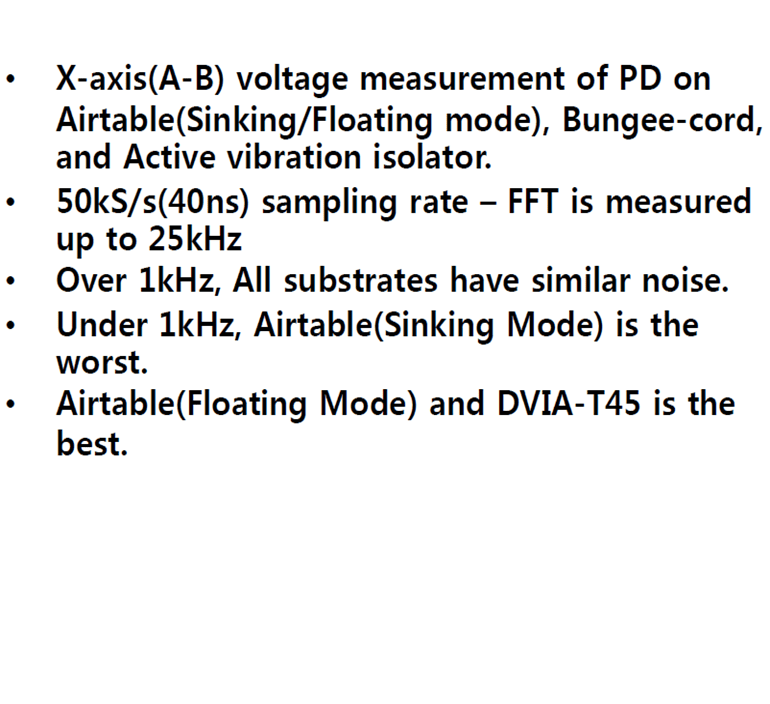


Analysis - Standard Deviation
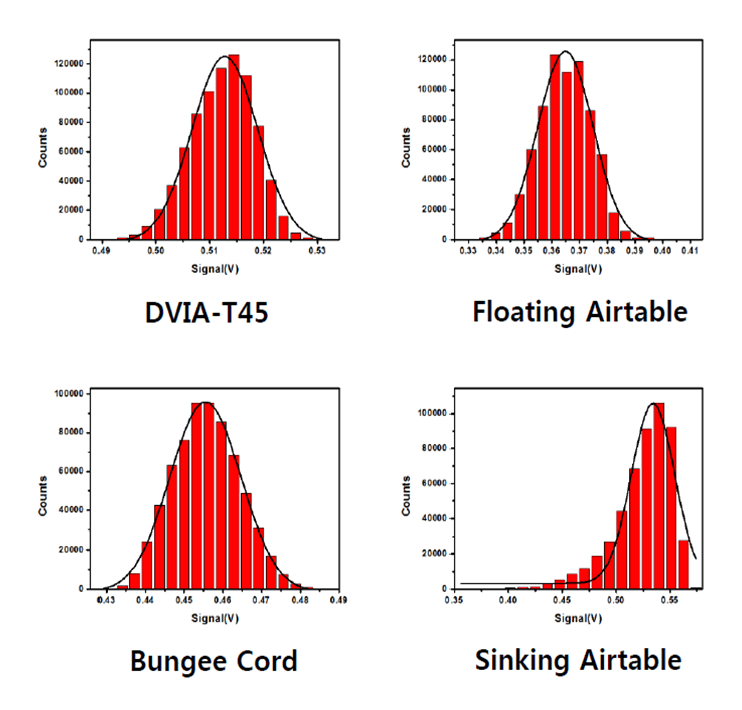
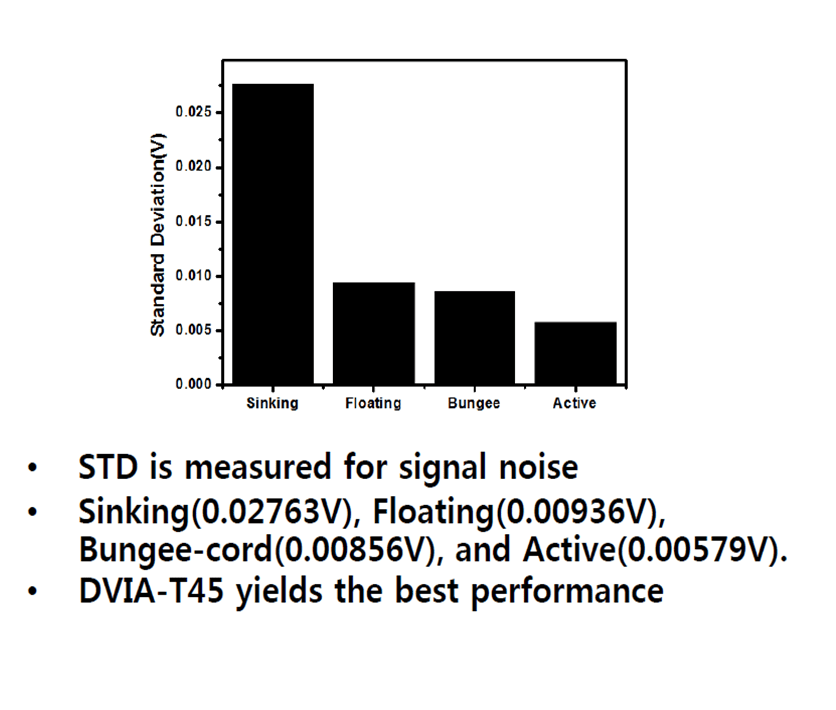


Imaging TEST in Different Substrate (Silicon Cantilever)
![]()
HOLOGRAPHINC MICROSCOPE
TOMOCUBE 3D HOLOGRAPHIC MICROSCOPE installed on DVIA-T56
Without active vibration isolation
With active vibration isolation
50nm RESOLUTION MICROSCOPE
50 nm lateral resolution MICROSCOPE installed on DVIA-T56
Passive vibration isolation
Active vibration isolation
Passive Vibration Isolation Mode
Active Vibration Isolation Mode
LIVE CELL IMAGING MICROSCOPE
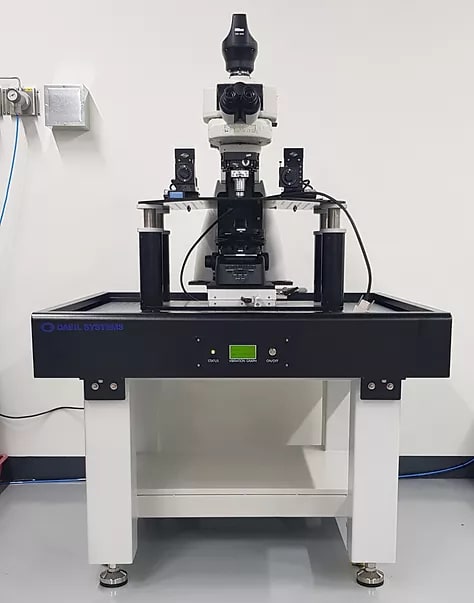
NIKON DS-Qi2 + OLYMPUS U-CMAD3 + U-TV1X-2(LIVE CELL IMAGING MICROSCOPE installed on THE CUSTOM DVIA-UD 350 (Desk Active Vibration Isolation Platform)
cell imaging
Active vibration isolation mode is turned on at 00:14
JEOL Tabletop SEM
| Service Report Number: | NSR-0063-DAE-JEOL-20210202 |
| Date of Service: | 2nd February 2021 |
Customer Information
| Customer Organization : | JEOL Asia Pte Ltd |
| End-user Contact : | Mr. Patrick Lim |
| Address : | 2 Corporation Rd, #01-12 Lobby A of Corporation Place Singapore 618494 |
System Information
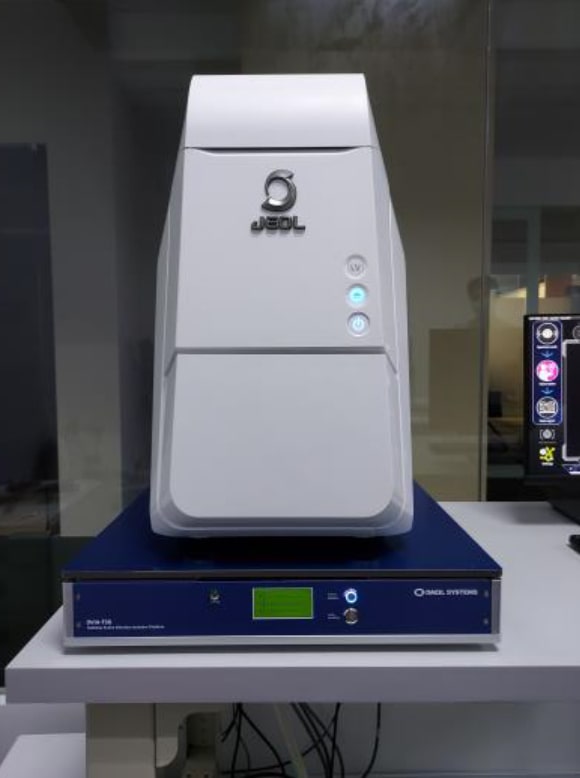
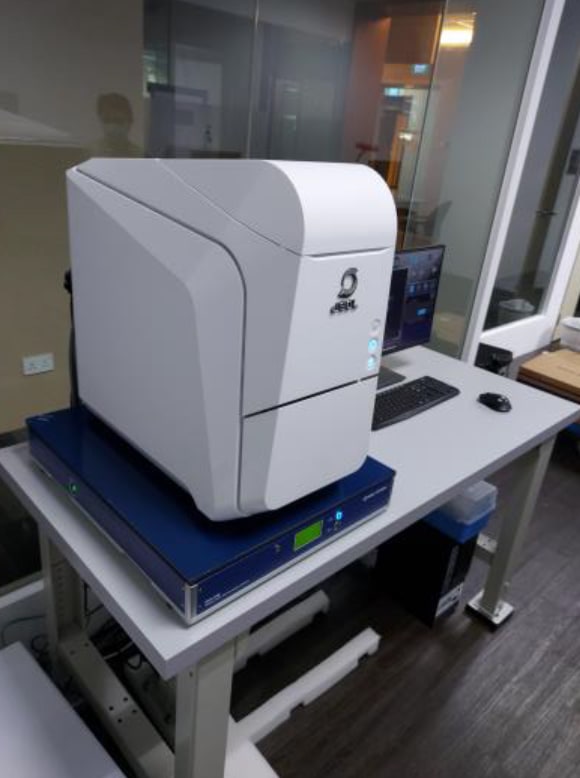
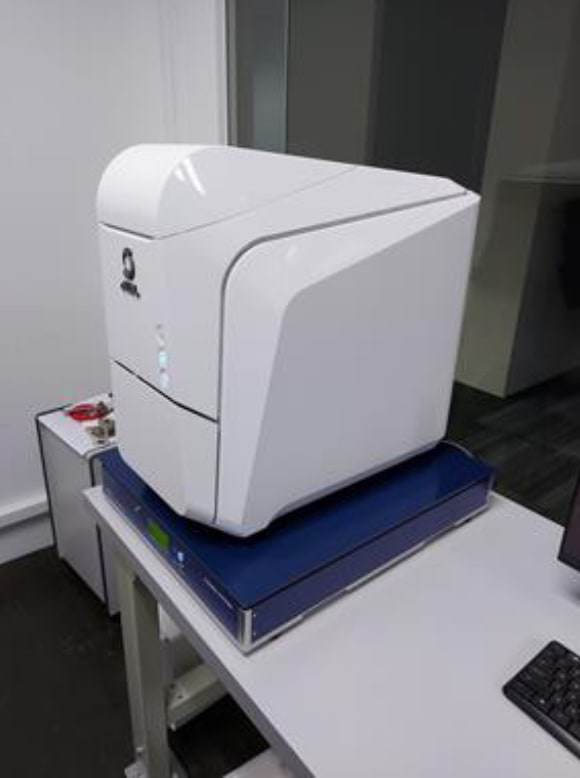
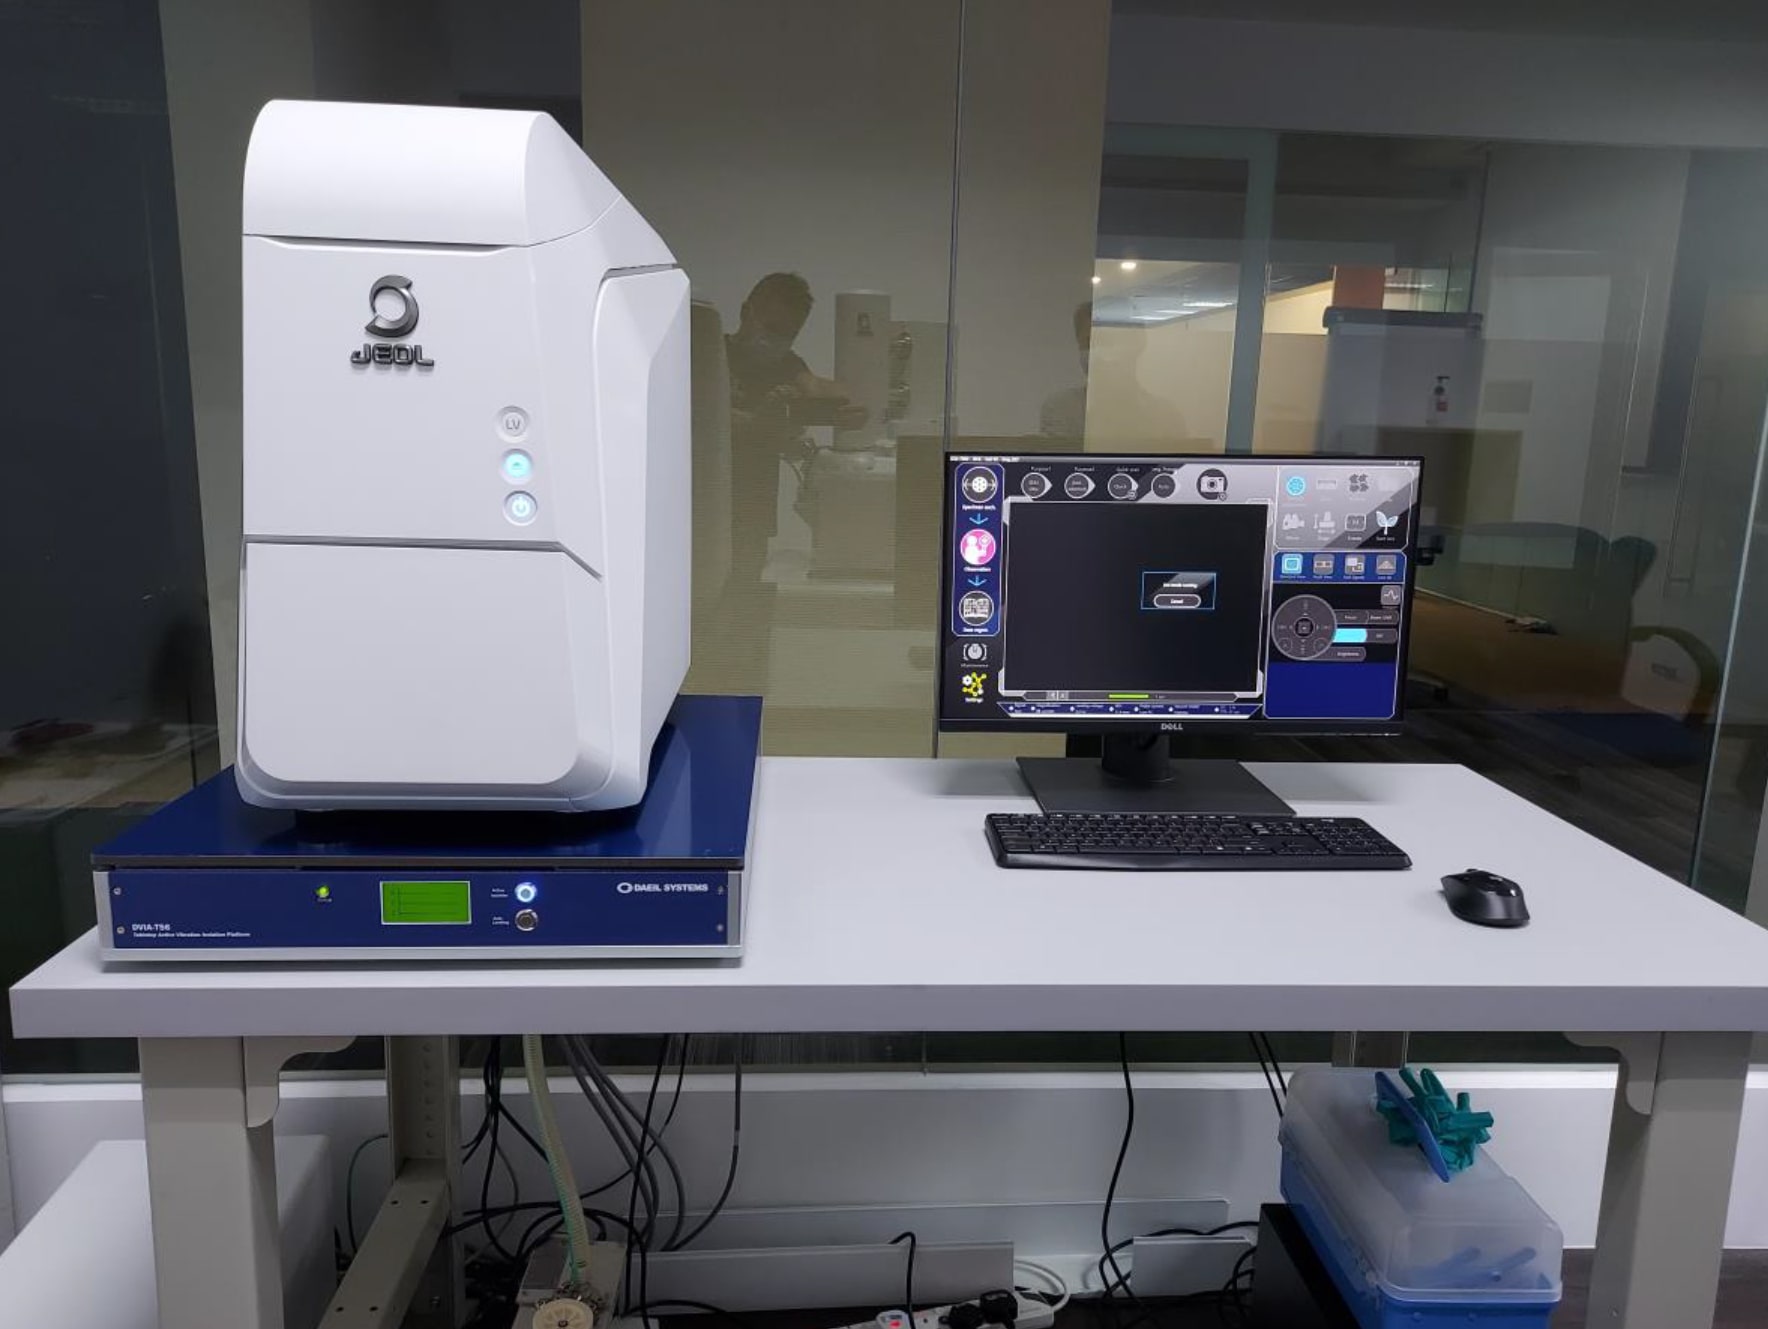
| System / Model : | DAEIL DVIA-T56 Active Vibration Isolation Platform (Benchtop) |
| System Serial Number : | 210112R11 |
| Service Type : | Installation for JEOL JCM-7000 Tabletop SEM |
| System Status : | Demo |
Job Summary
- Un-crate the platform and checks all parts for the active vibration isolation platform. Complete delivery without missing part/component.
- Positioned the DVIA-T56 under the JEOL JCM-7000 Tabletop SEM.
- Powered up the DVIA-T56 and performed auto load adjustment.
- Turned on isolation for the DVIA-T56.
- Performed remote tuning by DAEIL engineer for optimum performance.
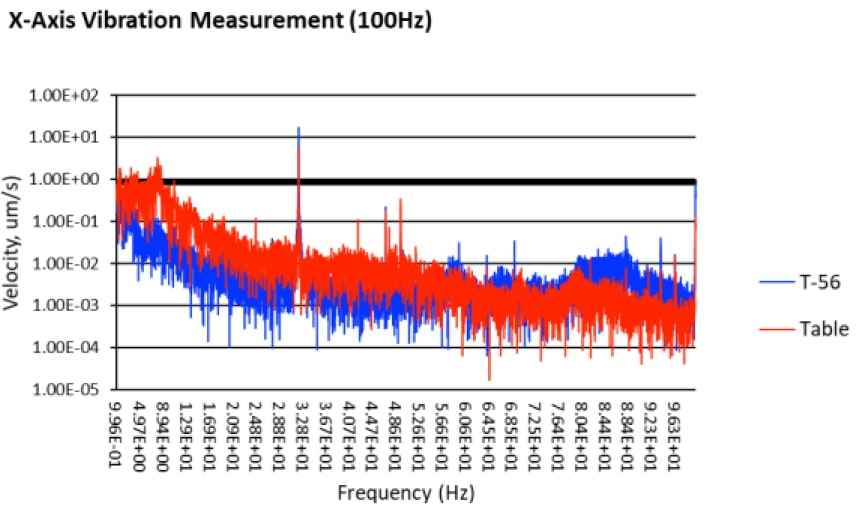
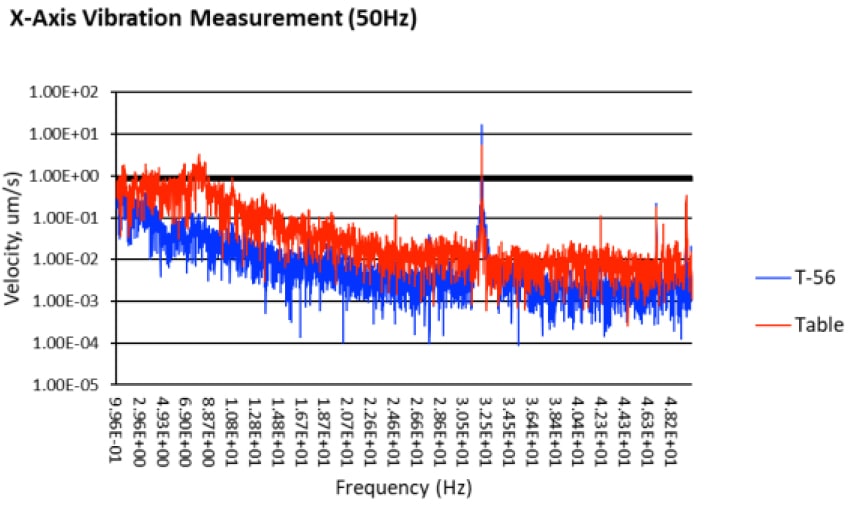
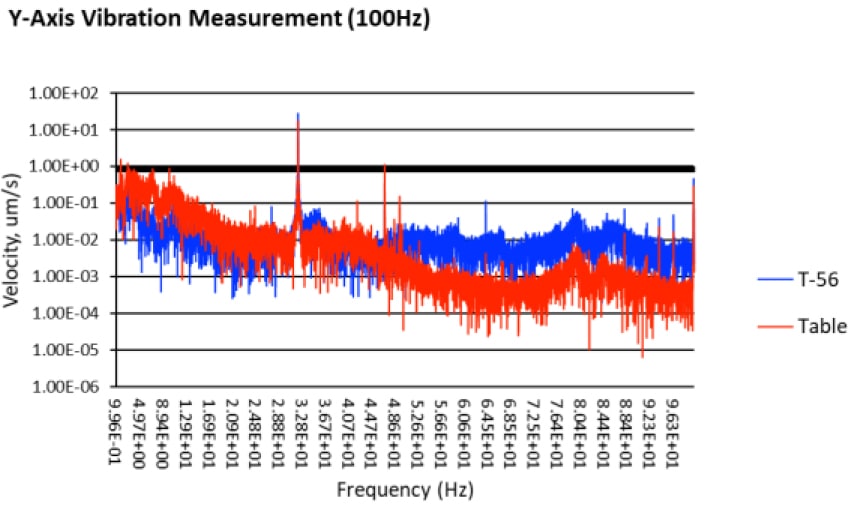
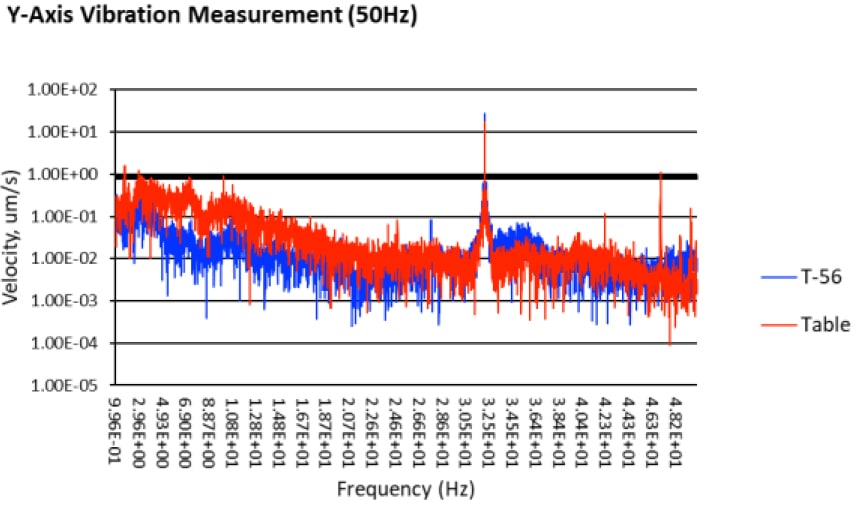
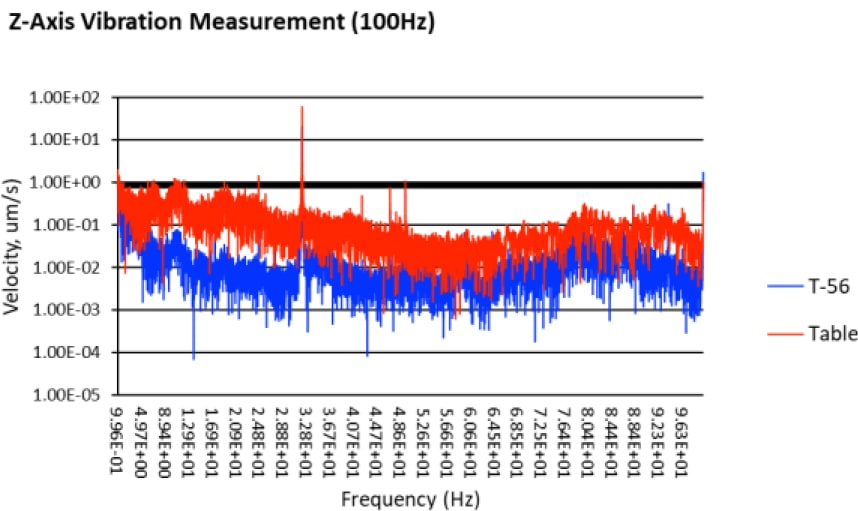
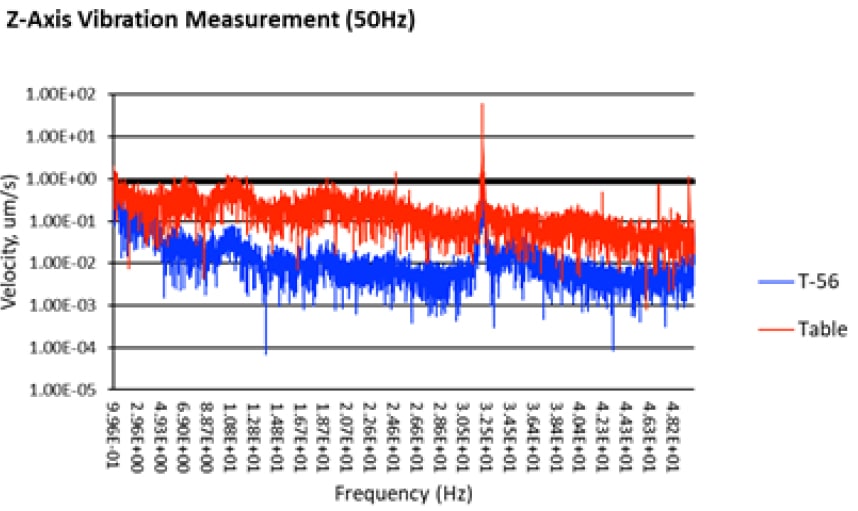
- Performed vibration measurements on the table and base plate of the platform.
- Please refer to appendix A for the vibration plots for XYZ.
- Please refer to appendix B for the system images.
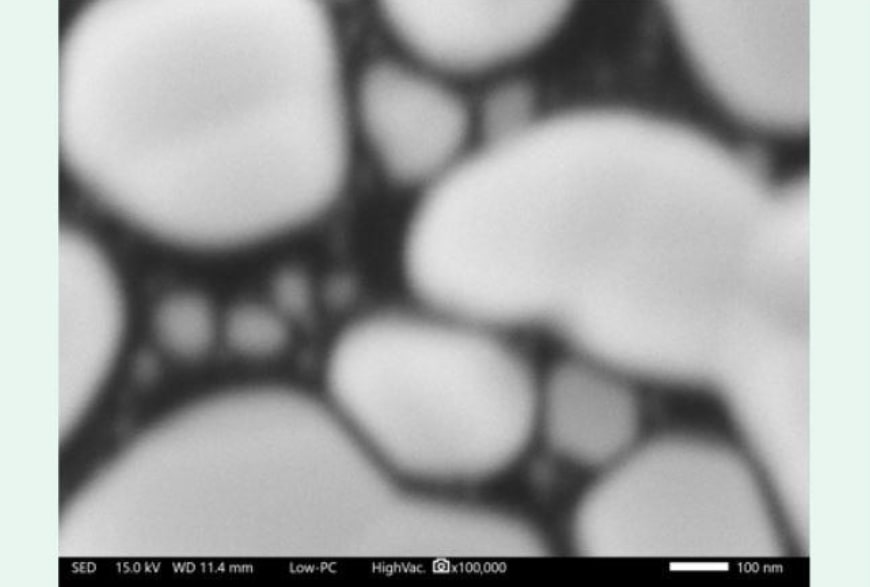
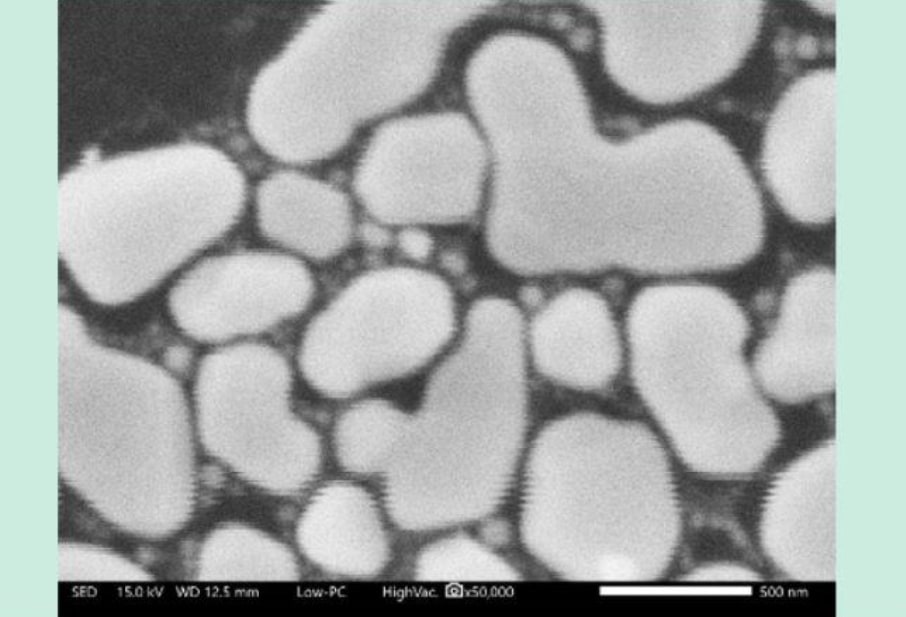
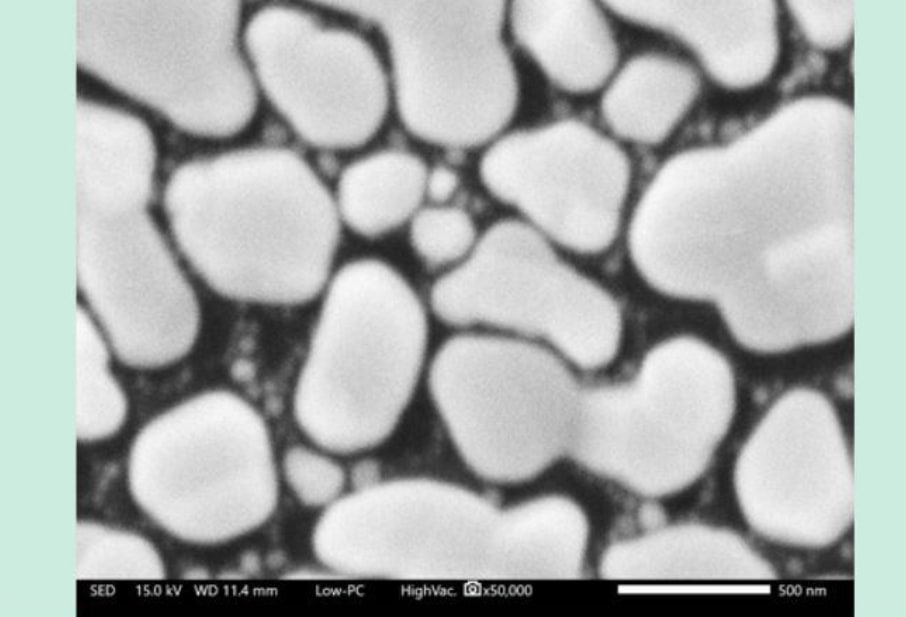
- Please refer to appendix C for the Gold on carbon images at 50kX and 100kX.
Conclusion:
Installation has been successfully completed and system performance is optimum for the T-56.
APPENDIX A: Vibration measurements for X, Y, Z
Appendix B: System images
Appendix C:
Bare system
Daeil
1280 x 1024 (10s)
Bare system
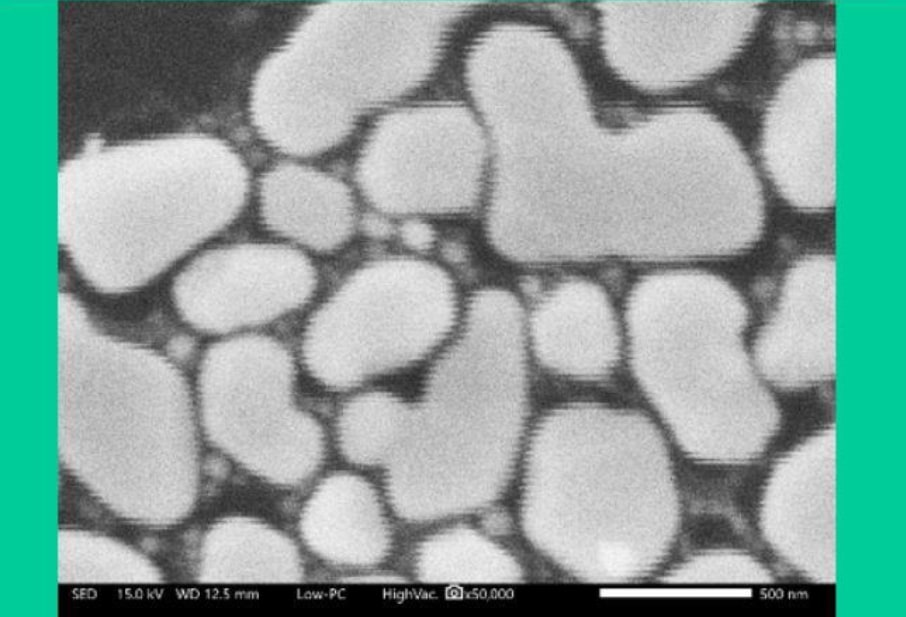
Daeil
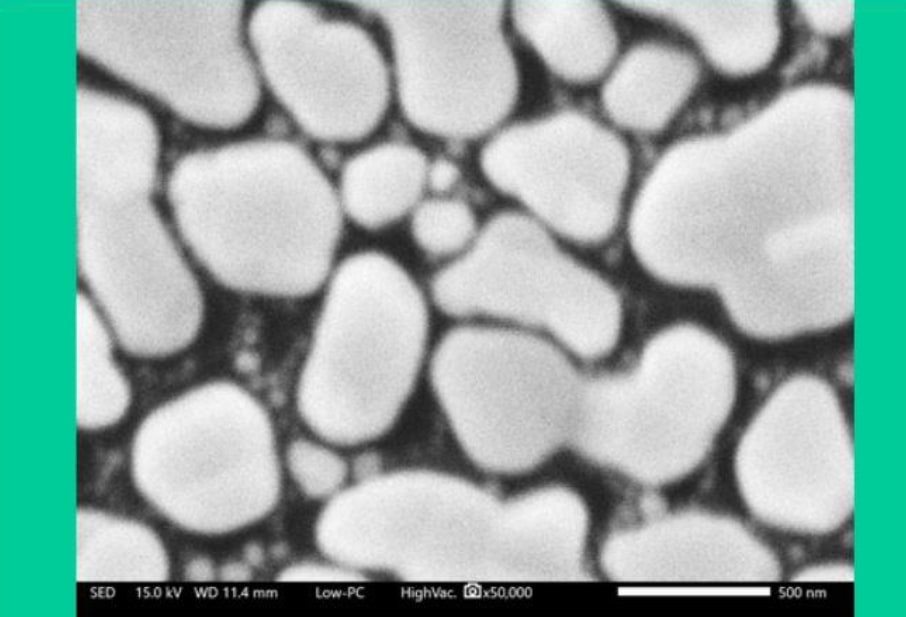
1280 x 1024 (20s)
Bare system
Daeil
2560 x 2048
Bare system
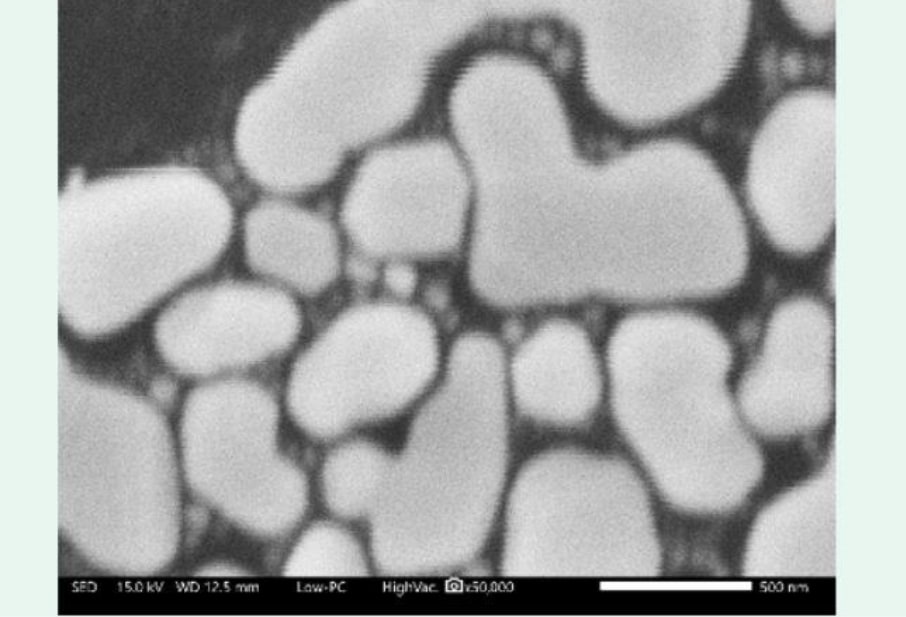
Daeil
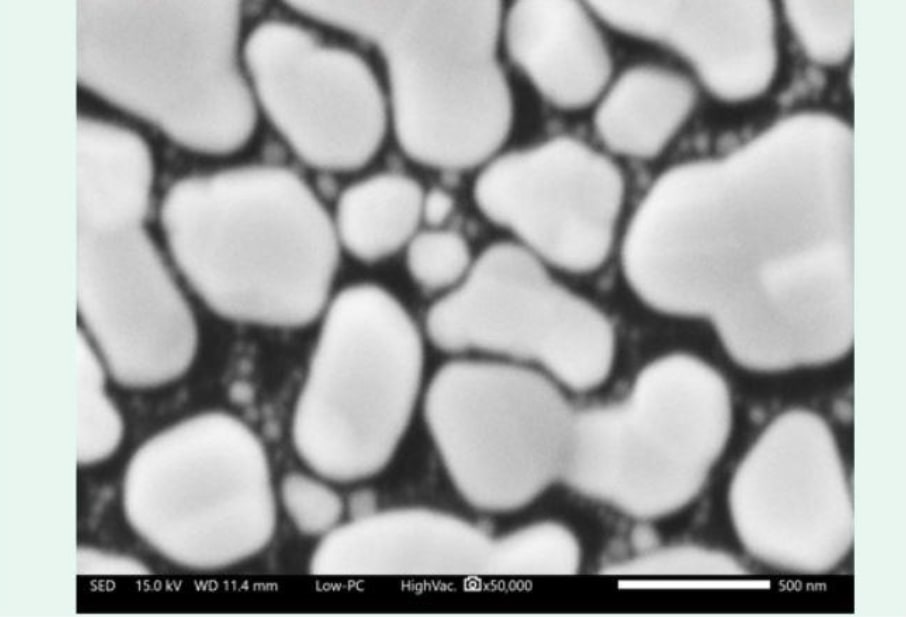
Bare system
Daeil
1280 x 1024 (10s)
Bare system
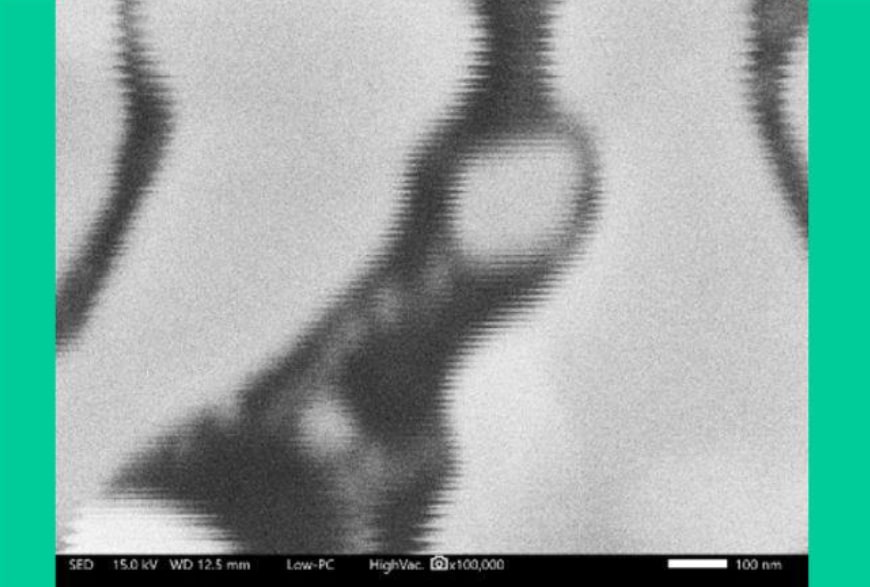
Daeil
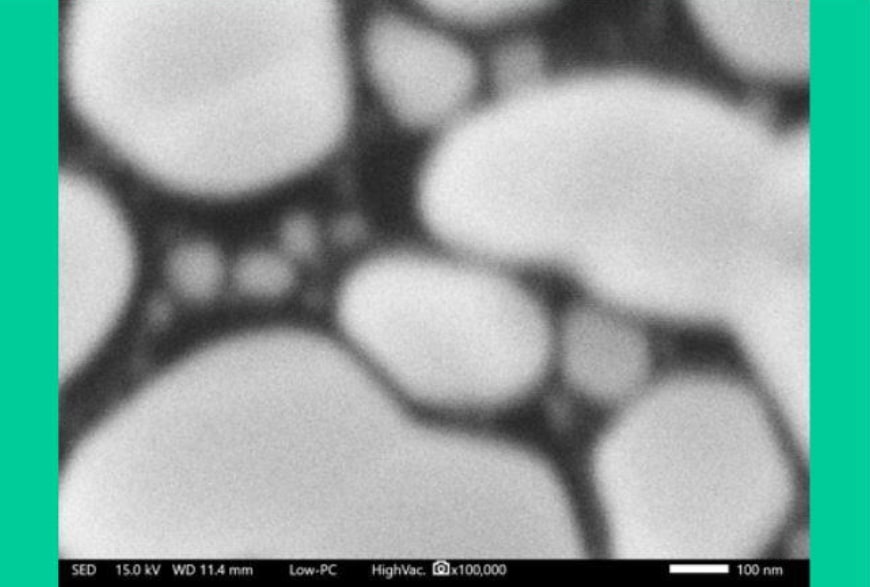
1280 x 1024 (20s)
Bare system
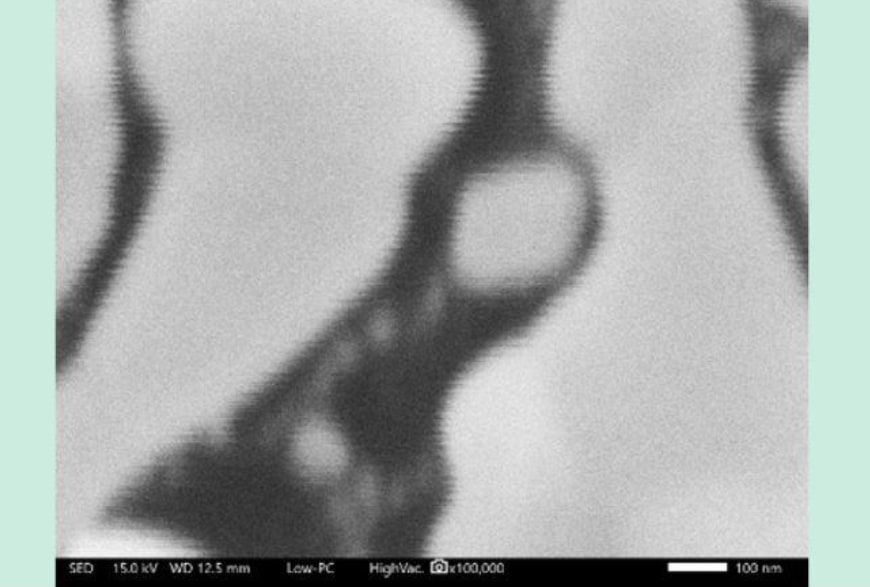
Daeil
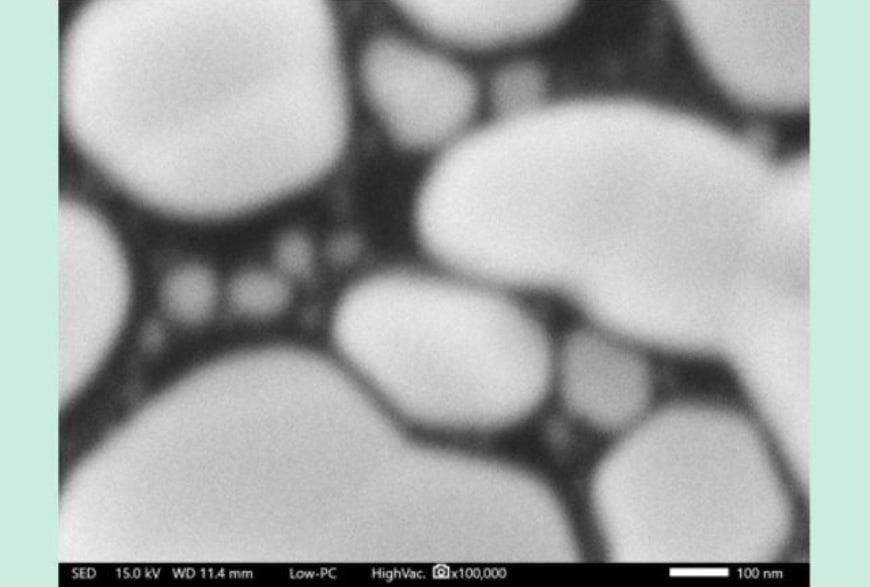
2560 x 2048
Bare system
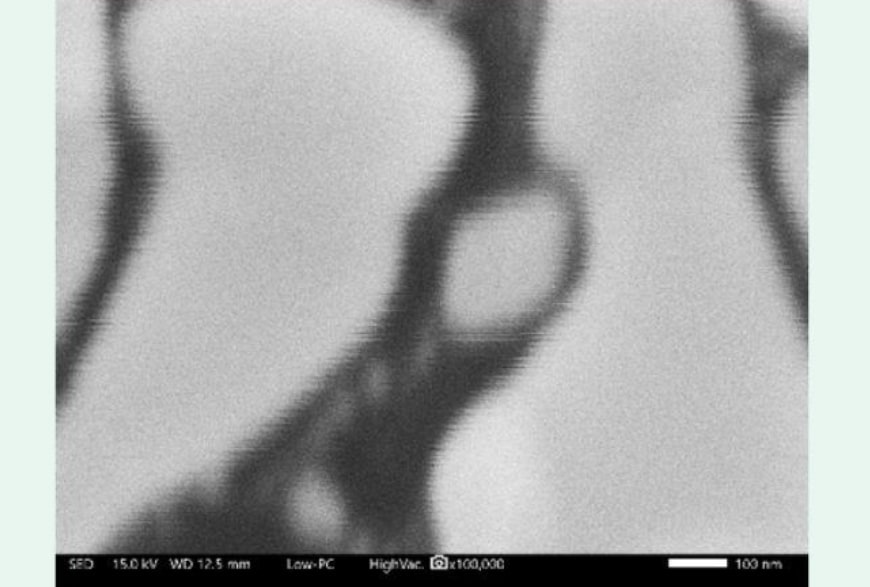
Daeil
