DVIA-M Series
Built In.Perfect Imaging.
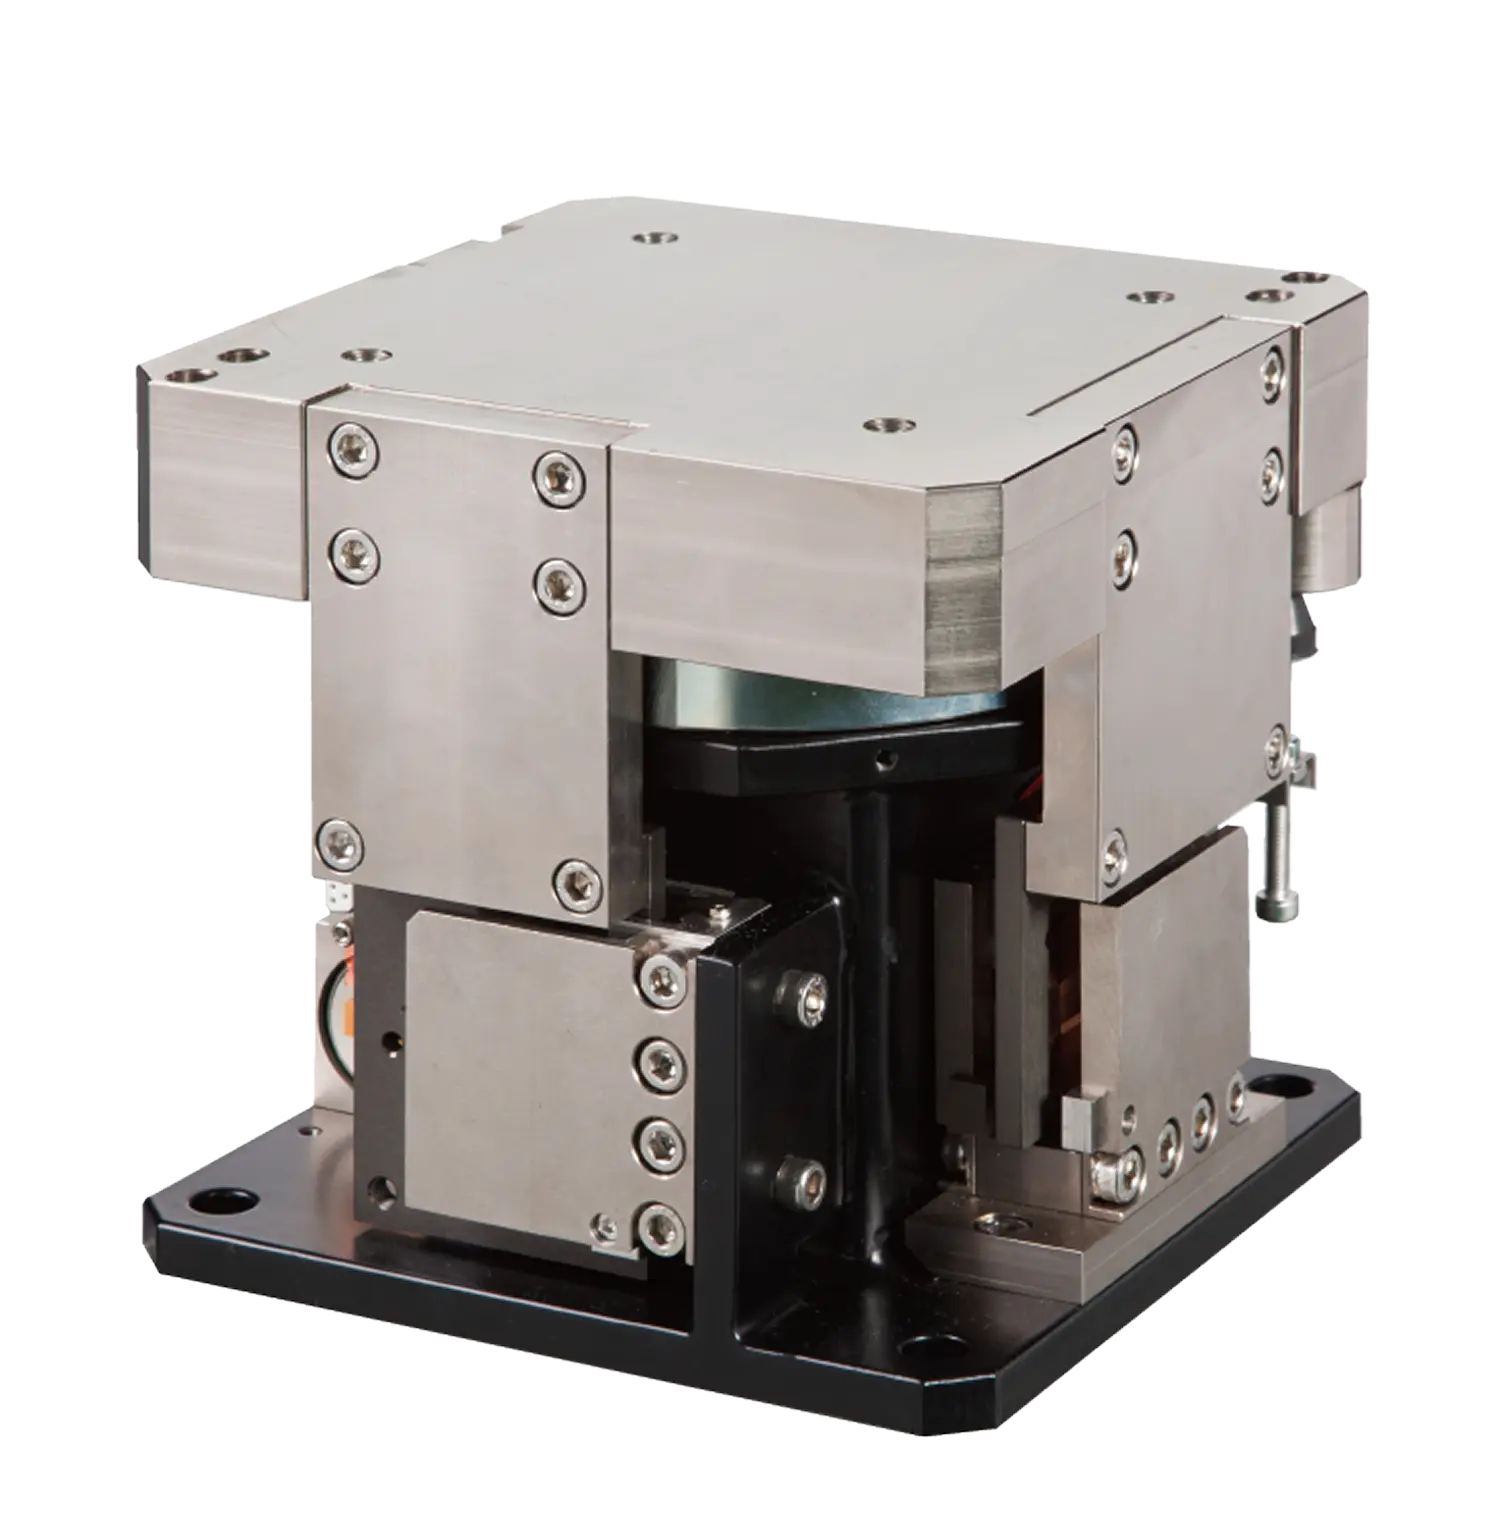
Seamless integration into electron microscopes.
Active vibration isolation module purpose-built for integration into the world's most advanced electron microscopes.Active vibration isolation module purpose-built for integration into the world's most advanced electron microscopes.
Built into the world's most demanding microscopes.Built into the world's
most demanding microscopes.
Achieving vibration criteria up to VC-G, the DVIA-M sets new standards across all supported microscope categories. Every instrument demands a bespoke isolation strategy. The DVIA-M is engineered to match.Achieving vibration criteria up to VC-G, the DVIA-M sets new standards across all supported microscope categories.
Every instrument demands a bespoke isolation strategy. The DVIA-M is engineered to match.
SEM
Scanning Electron Microscopy
Nano-surface imaging without drift
Floor vibrations cause image drift and blur at magnifications above 50,000×. The DVIA-M cancels disturbances from 0.5 Hz, keeping electron beams precisely on target for artifact-free SEM imaging.Floor vibrations cause image drift and blur at magnifications above 50,000×. The DVIA-M cancels disturbances from 0.5 Hz, keeping electron beams precisely on target for artifact-free SEM imaging.
Supported Manufacturers
Thermo Fisher · ZEISS · JEOL · TESCAN · Hitachi · CIQTEK
TEM
Transmission Electron Microscopy
Atomic resolution. Zero mechanical noise
HRTEM and STEM modes demand sub-angstrom stability. Building vibrations — even imperceptible ones — destroy lattice fringe contrast. The DVIA-M provides the mechanical silence these instruments require.HRTEM and STEM modes demand sub-angstrom stability. Building vibrations — even imperceptible ones — destroy lattice fringe contrast. The DVIA-M provides the mechanical silence these instruments require.
Supported Manufacturers
Thermo Fisher · JEOL · Hitachi · TESCAN · CIQTEK
AFM
Atomic Force Microscopy
Picometer topography. Tip stays true.
AFM measures surface topography by physical contact between cantilever tip and sample. Any relative motion becomes measurement noise. At sub-angstrom probe sensitivity, building vibration becomes the dominant error source. The DVIA-M removes the floor as a noise source so the cantilever sees only the surface.AFM measures surface topography by physical contact between cantilever tip and sample. Any relative motion becomes measurement noise. At sub-angstrom probe sensitivity, building vibration becomes the dominant error source. The DVIA-M removes the floor as a noise source so the cantilever sees only the surface.
Supported Manufacturers
Bruker · Semilab · Oxford Instruments
Outperforms. Everything.
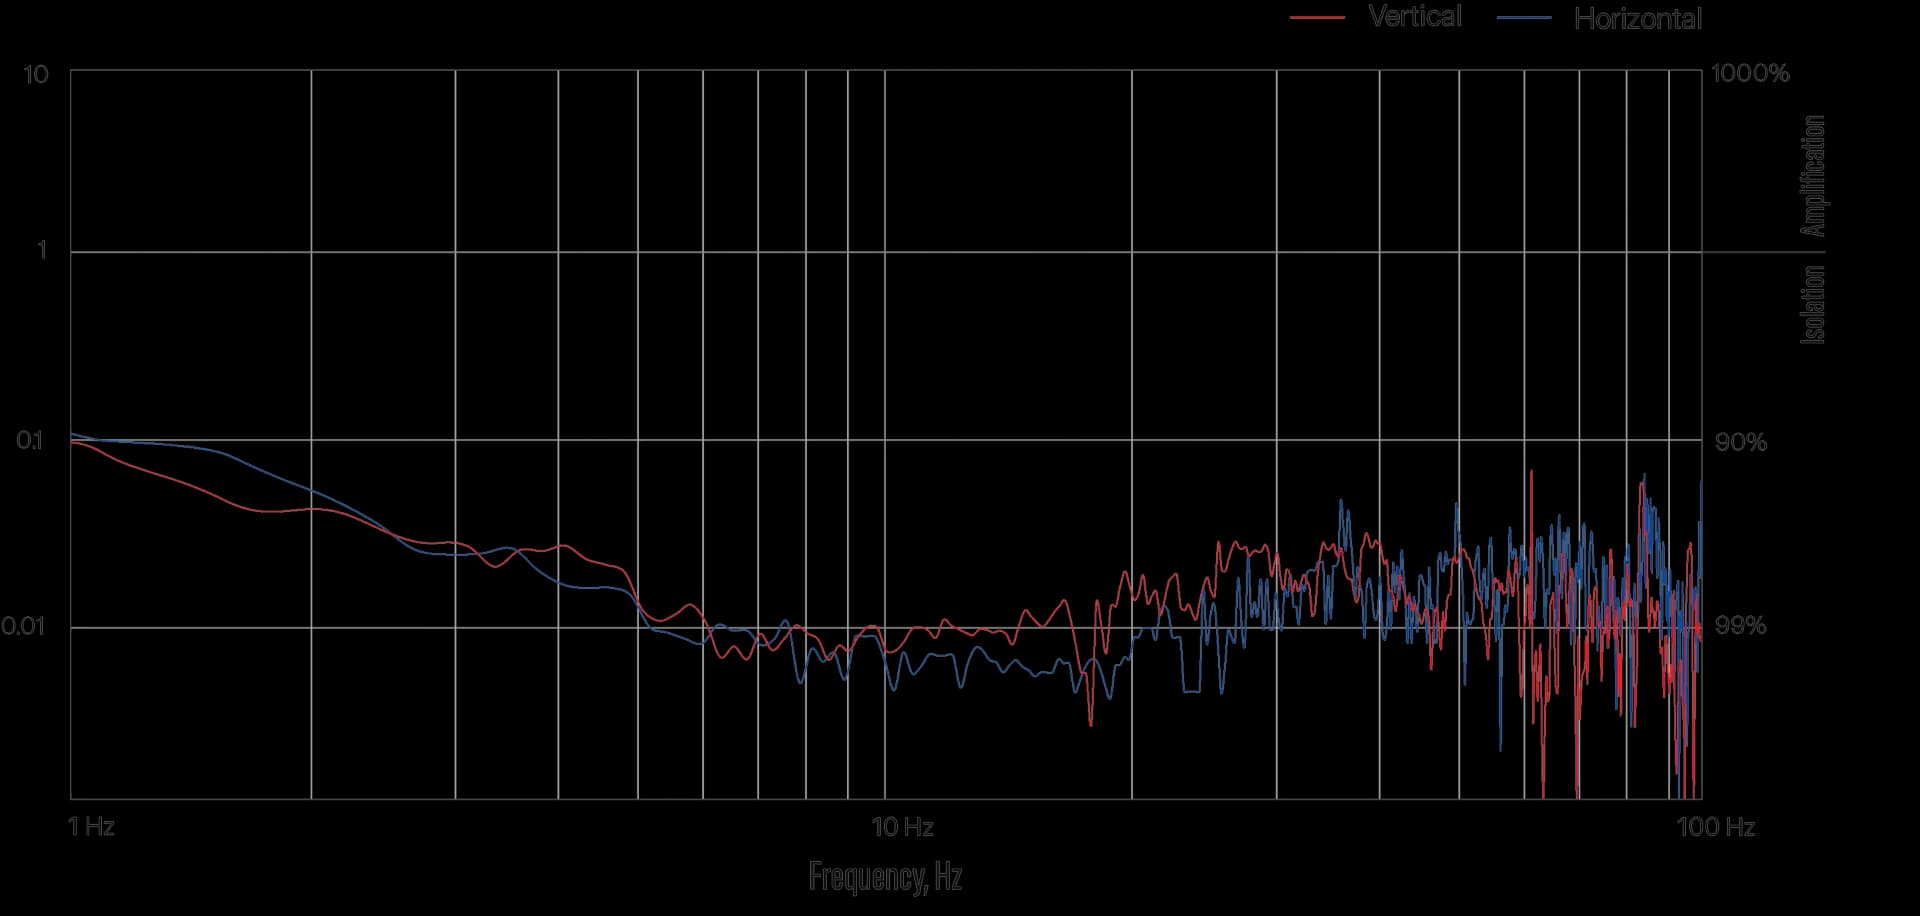
Isolation from 0.5 Hz.
Feedback corrects. Feedforward anticipates.
Feedback measures vibration on the isolated mass and counters it in real time. Feedforward reads the floor and cancels disturbances before they arrive. Together, they deliver exceptional low-frequency isolation. Your instruments operate as if the vibration doesn't exist.
 How it works
Passive Isolation (Spring & Damper):
Without active controls, the spring (k) and damper try to absorb shocks. However, at low frequencies, they can actually amplify the floor disturbance (d), causing the mass to resonate.
Feedforward Control:
Leverages ground sensor data to proactively command the actuators, nullifying floor vibrations before they reach the isolated mass.
Feedback Control:
Continuously measures the isolated mass's residual vibration (y) and uses the actuators to counteract it in real time.
Together, these advanced control mechanisms significantly enhance isolation performance, keeping the mass nearly perfectly still!
System Controls
Floor Disturbance
Simulate low-frequency vibration
Feedforward Control
Proactive floor sensing
Feedback Control
Reactive mass correction
Every detail engineered
for nanoscale precision.
Stage 1: Raw Input
Extremely subtle micro-vibrations are captured by the sensors. Due to their low amplitude, they are easily lost amidst ambient noise.
Stage 2: Hardware Amp
The DVIA-M unit applies analog gain to boost the entire signal. Both the desired low-frequency wave and the high-frequency noise are amplified.
Stage 3: Software Filter
Advanced digital algorithms isolate and retain only frequencies down to 0.3 Hz, entirely stripping away the noise to leave a clean, readable sine wave.
Detection from 0.3 Hz.
A hardware amplifier boosts low-frequency gain.
A digital filter refines the signal. Together, they extend
accurate detection and isolation down to 0.3 Hz.
Responds before you notice.
A floating-point DSP delivering 1800 MFLOPS
processes vibration data in real time.
Response time: 0.5 ms. By the time vibrations reach
your microscope, it's already been cancelled.
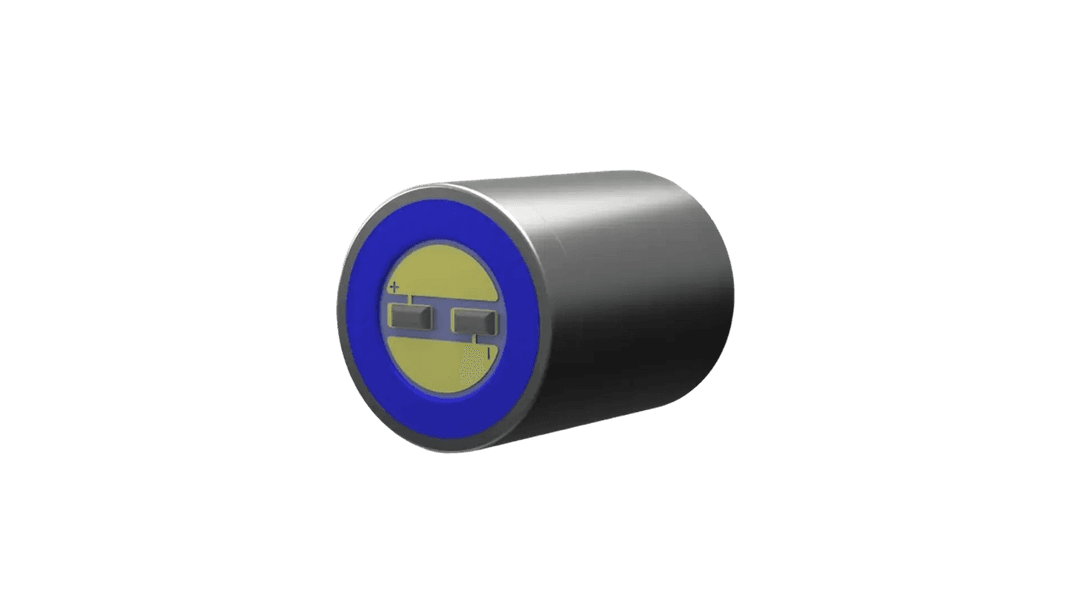
Detects the imperceptible.
11 Geophone velocity sensors with 2.55 V/in/s sensitivity and just 0.15% distortion. They capture low frequency vibrations other systems miss entirely so the DVIA-M can cancel what it can't ignore.
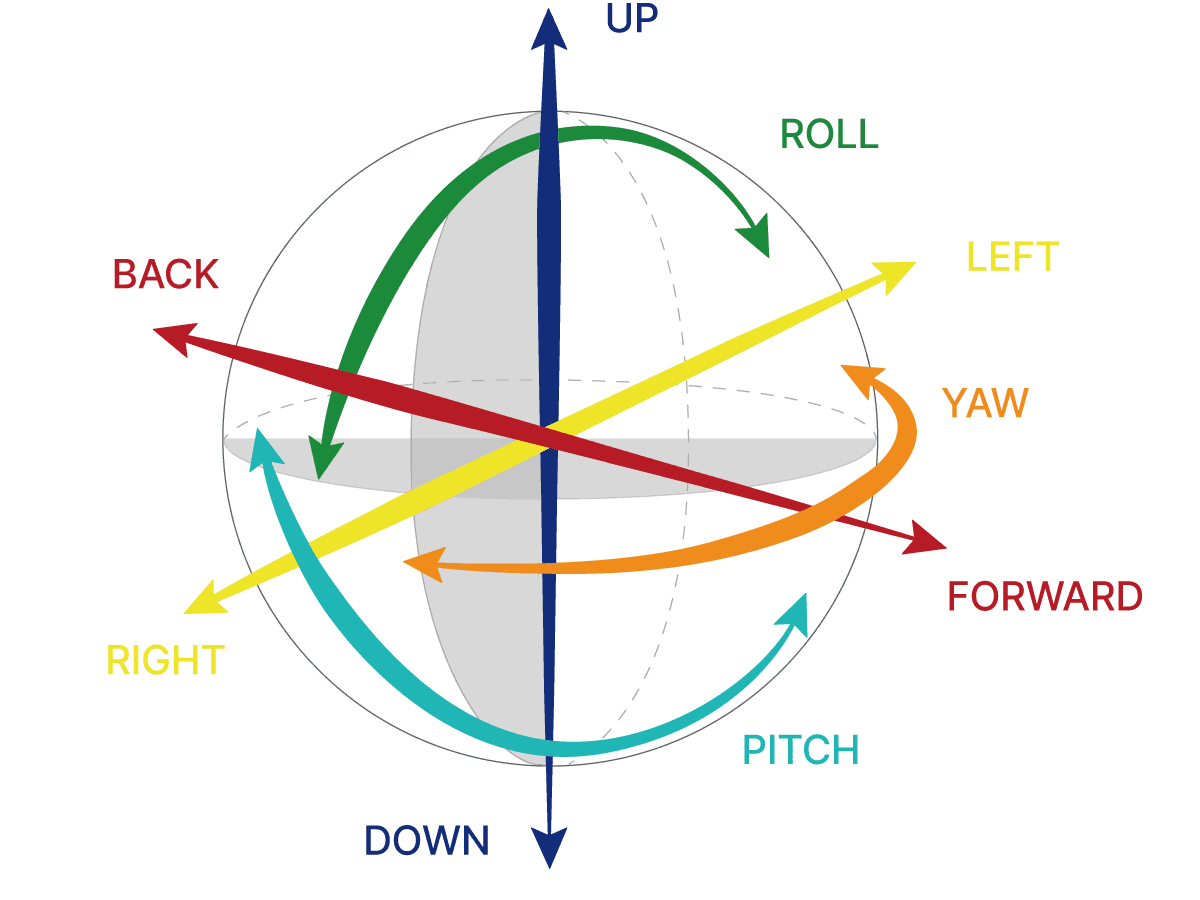
Six axes. Zero compromise.
The DVIA-M controls all six degrees of freedom. Three translational, three rotational. No vibration path goes uncorrected. Its algorithm decouples each axis independently, eliminating cross-coupling. Sub-micron translational and sub-microradian angular stability, maintained simultaneously.
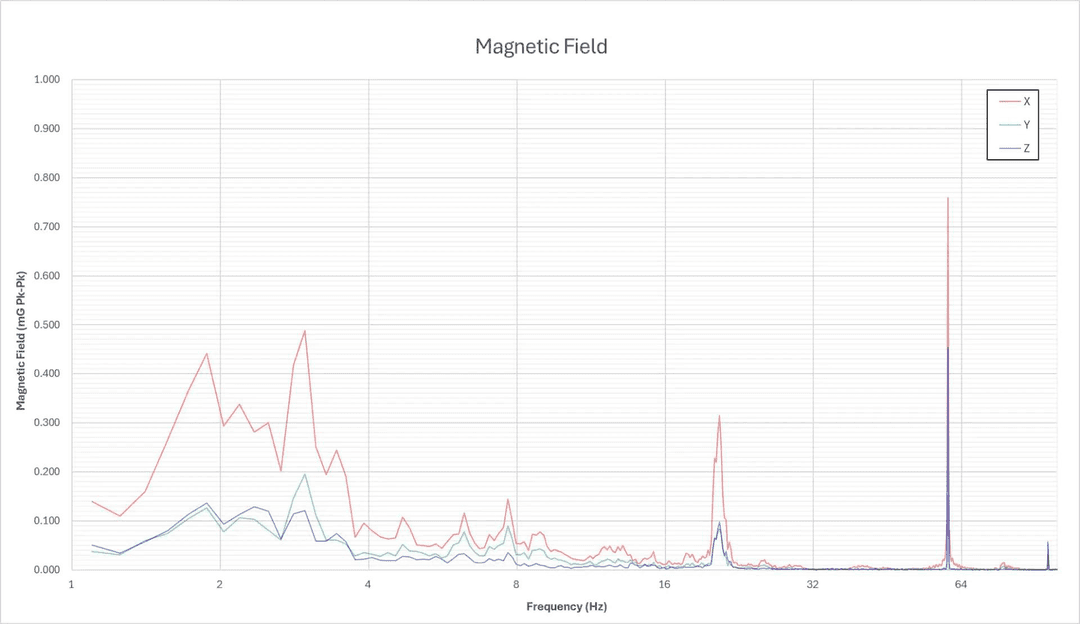
Magnetically silent.
Less than 0.05 μT magnetic field. Electron beams are sensitive to the smallest magnetic interference. The DVIA-M is engineered to be magnetically silent — your beam stays true, your images stay sharp.
User Interface. Monitor. Log. Verify data.User Interface.
Monitor. Log. Verify data.
The DVIA-M UI displays real-time vibration levels, actuator response, and sensor output across all six axes. All data can be logged automatically. Review historical trends, export reports, or verify isolation performance at any time. No hidden processes. No black-box algorithms. Your facility team sees exactly what the system is doing, why it's responding, and how it's performing against specification.The DVIA-M UI displays real-time vibration levels, actuator response, and sensor output across all six axes. All data can be logged automatically. Review historical trends, export reports, or verify isolation performance at any time. No hidden processes. No black-box algorithms. Your facility team sees exactly what the system is doing, why it's responding, and how it's performing against specification.
Transmissibility Curve
Auto Spectrum
VC Curves
Sensors and Actuators
Specifications
Specifications
- Dimensions
- Customizable
- Maximum Load Capacity
- 1500 kg
- Dimensions
- Customizable
- Maximum Load Capacity
- 3000 kg
- Vibration Isolation Technology
- Feedback and Feedforward Control
- Degrees of Freedom
- 6 (X, Y, Z, θx, θy, θz)
- Active Isolation Bandwidth
- 0.5 – 200 Hz
- Vibration Isolation
- 80 – 90% at 1 Hz
- Actuator
- Electromagnetic Actuator
- Maximum Actuator Force
- Vertical 40 N, Horizontal 20 N
- Vibration Sensor
- Geophone, Sensitivity: 2.55 V/in/s (100.4 V/m/s) ± 10%
- Leveling Repeatability
- Repeatability: ± 0.1 mm
- Controller
- External
- Environmental Protection
- CE and TUV
- Power Requirements
- Line Voltage: 100 – 260 V AC, Line Frequency: 50/60 Hz
- Air Requirements
- Air Pressure: 4 – 6 bar, Air Delivery: 10 L/min
- Environmental Requirements
- Temperature: 5 – 50 °C, Humidity: 20 – 90 %
Verified on-site. All performance claims are measured under controlled conditions and confirmed during installation. Dimensions and load capacity are customizable per instrument specification.
Case Studies
Proven in the field. Installed in the world's most advanced semiconductor, aerospace, and research facilities. Every system measured and verified on-site.Proven in the field. Installed in the world's most advanced semiconductor, aerospace, and research facilities.
Every system measured and verified on-site.
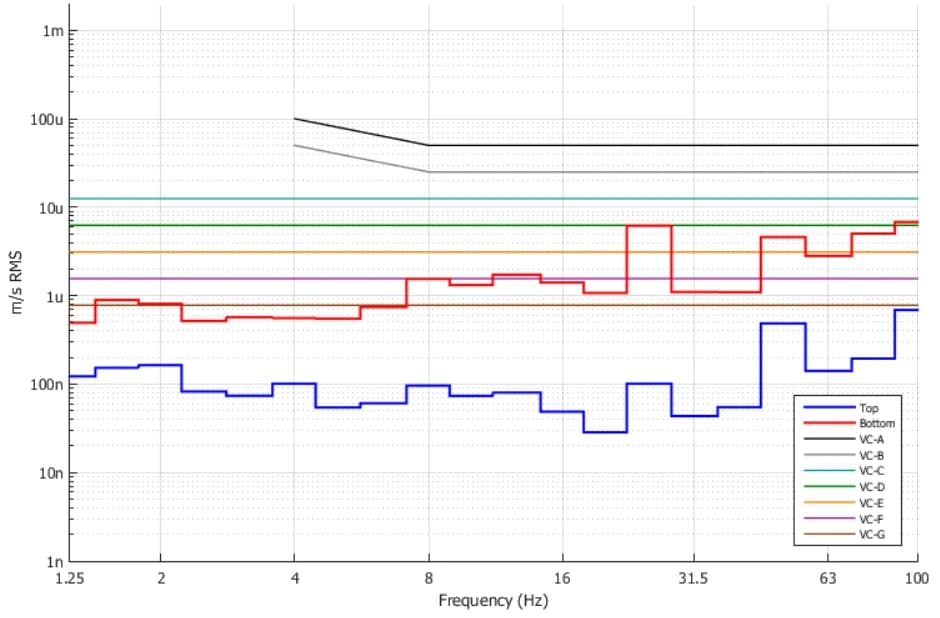
Quantum Photonics Research Laboratory attocube attoDRY1000/SU Cryostat DVIA-ML1000 Installation Report
DVIA-ML1000 installation report (serial 260725R2) for an attocube attoDRY1000/SU closed-cycle cryostat at Quantum Photonics Research Laboratory in Copenhagen, Denmark. Tuning was carried out on 2026.09.22, and vibration on the isolator top plate was verified against the customer VC-E requirement on all axes.
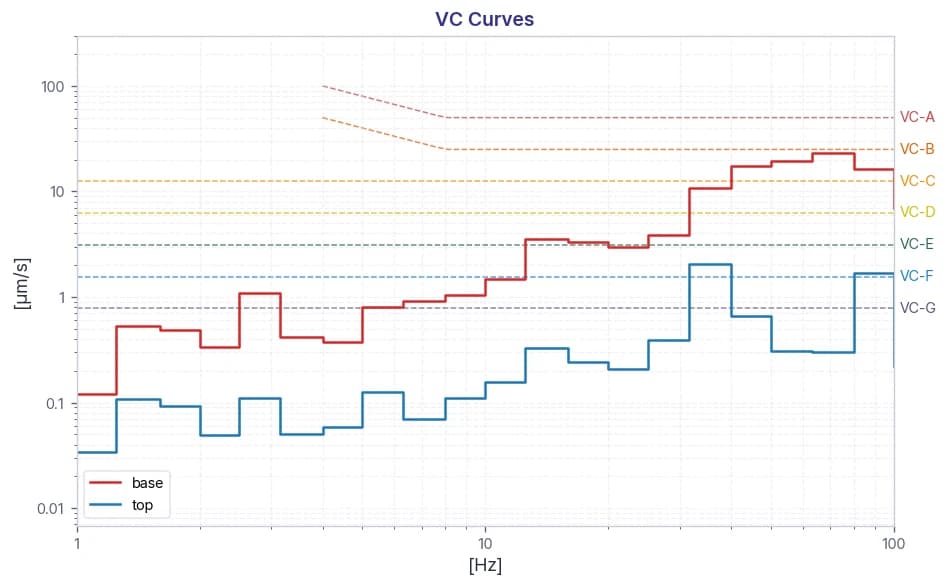
ASE Korea TESCAN FIB-SEM SOLARIS X2 GMH DVIA-ML1000 Installation Report
DVIA-ML1000 installation report (serial 260622R4) for a TESCAN FIB-SEM SOLARIS X2 GMH installed at ASE Korea PB1, 1CMD QO Lab, Electron Microscopy Room. Tuning was carried out on 2026.09.11 and vibration was measured with the equipment in the IDLE state. All three axes met the reference specification and achieved a PASS rating, with the vertical axis improving from VC-B to VC-E, the left-to-right axis from VC-E to VC-G, and the front-to-back axis from VC-B to VC-F.
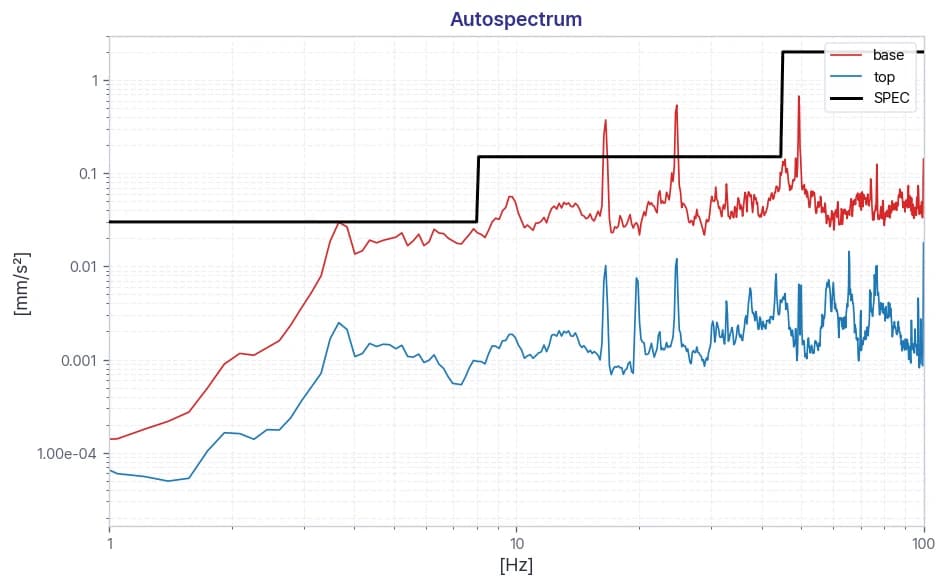
Resonac Electronic Materials ZEISS Sigma 360 FE-SEM DVIA-ML1000 Installation Report
ZEISS Sigma 360 FE-SEM DVIA-ML1000 installation report — the DVIA-ML1000 active vibration isolation platform was installed at Guangzhou for end user Resonac Electronic Materials, then re-tuned (2nd trial) and measured with the equipment Turned off. Against the Sigma 360 horizontal and vertical allowable vibration specification (mm/s² RMS, 1–100 Hz), the bare floor exceeded the limit on the vertical and front-to-back axes, while the DVIA-ML1000 platform passed on all three axes. The tuning request work order, the allowable vibration tables and the per-axis Autospectrum plots are published; no installation photographs were permitted at the site.
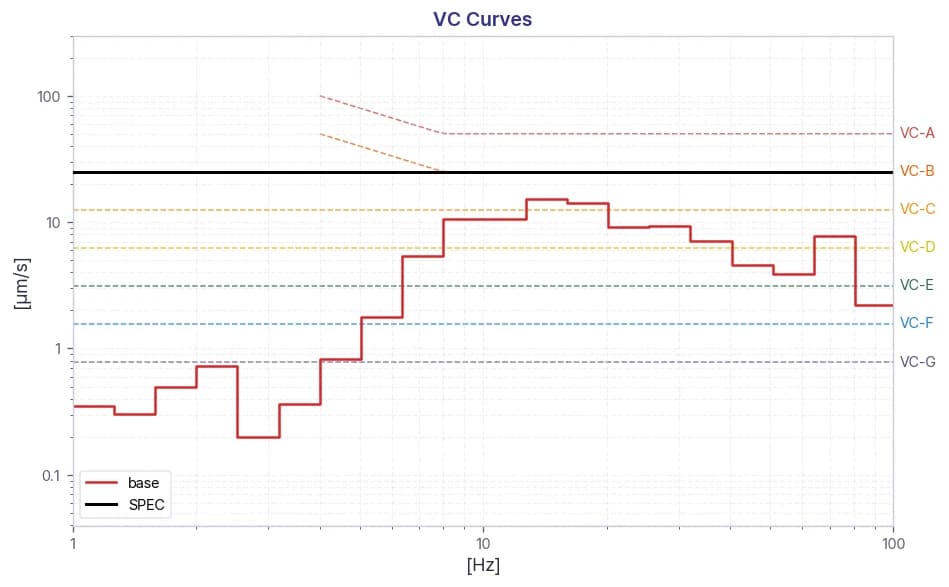
FST LAZIN LODAS-B18 Photomask Blank Inspection System DVIF-FB (241001R5) Installation Report — September 2026 Re-Measurement and Upper Equipment Lower Frame Baseline
Installation report for the measurement carried out on 3 September 2026 on the DVIF-FB-1000x2000x3000H vibration isolation platform (S/N 241001R5) in the 3rd floor cleanroom of the FST Osan plant, on which a LAZIN LODAS-B18 photomask blank inspection system is mounted. This is a separate visit that follows the top plate reinforcement verification of August 2026: the DVIF-FB top plate was re-measured at the customer's request to verify the reliability of the existing data, and the lower frame of the upper equipment was measured for the first time to obtain baseline data before Bilz pads are applied. Measurement was performed with the equipment in the IDLE state against a 25 µm/s RMS (VC-B) requirement in both the horizontal and vertical directions. The top plate reproduced the earlier result — PASS in the vertical (Z) and left to right (X) directions and FAIL in the front to back (Y) direction — while the upper equipment lower frame exceeded the specification on all three axes. Autospectrum and VC Curves are published for each axis at both measurement points.
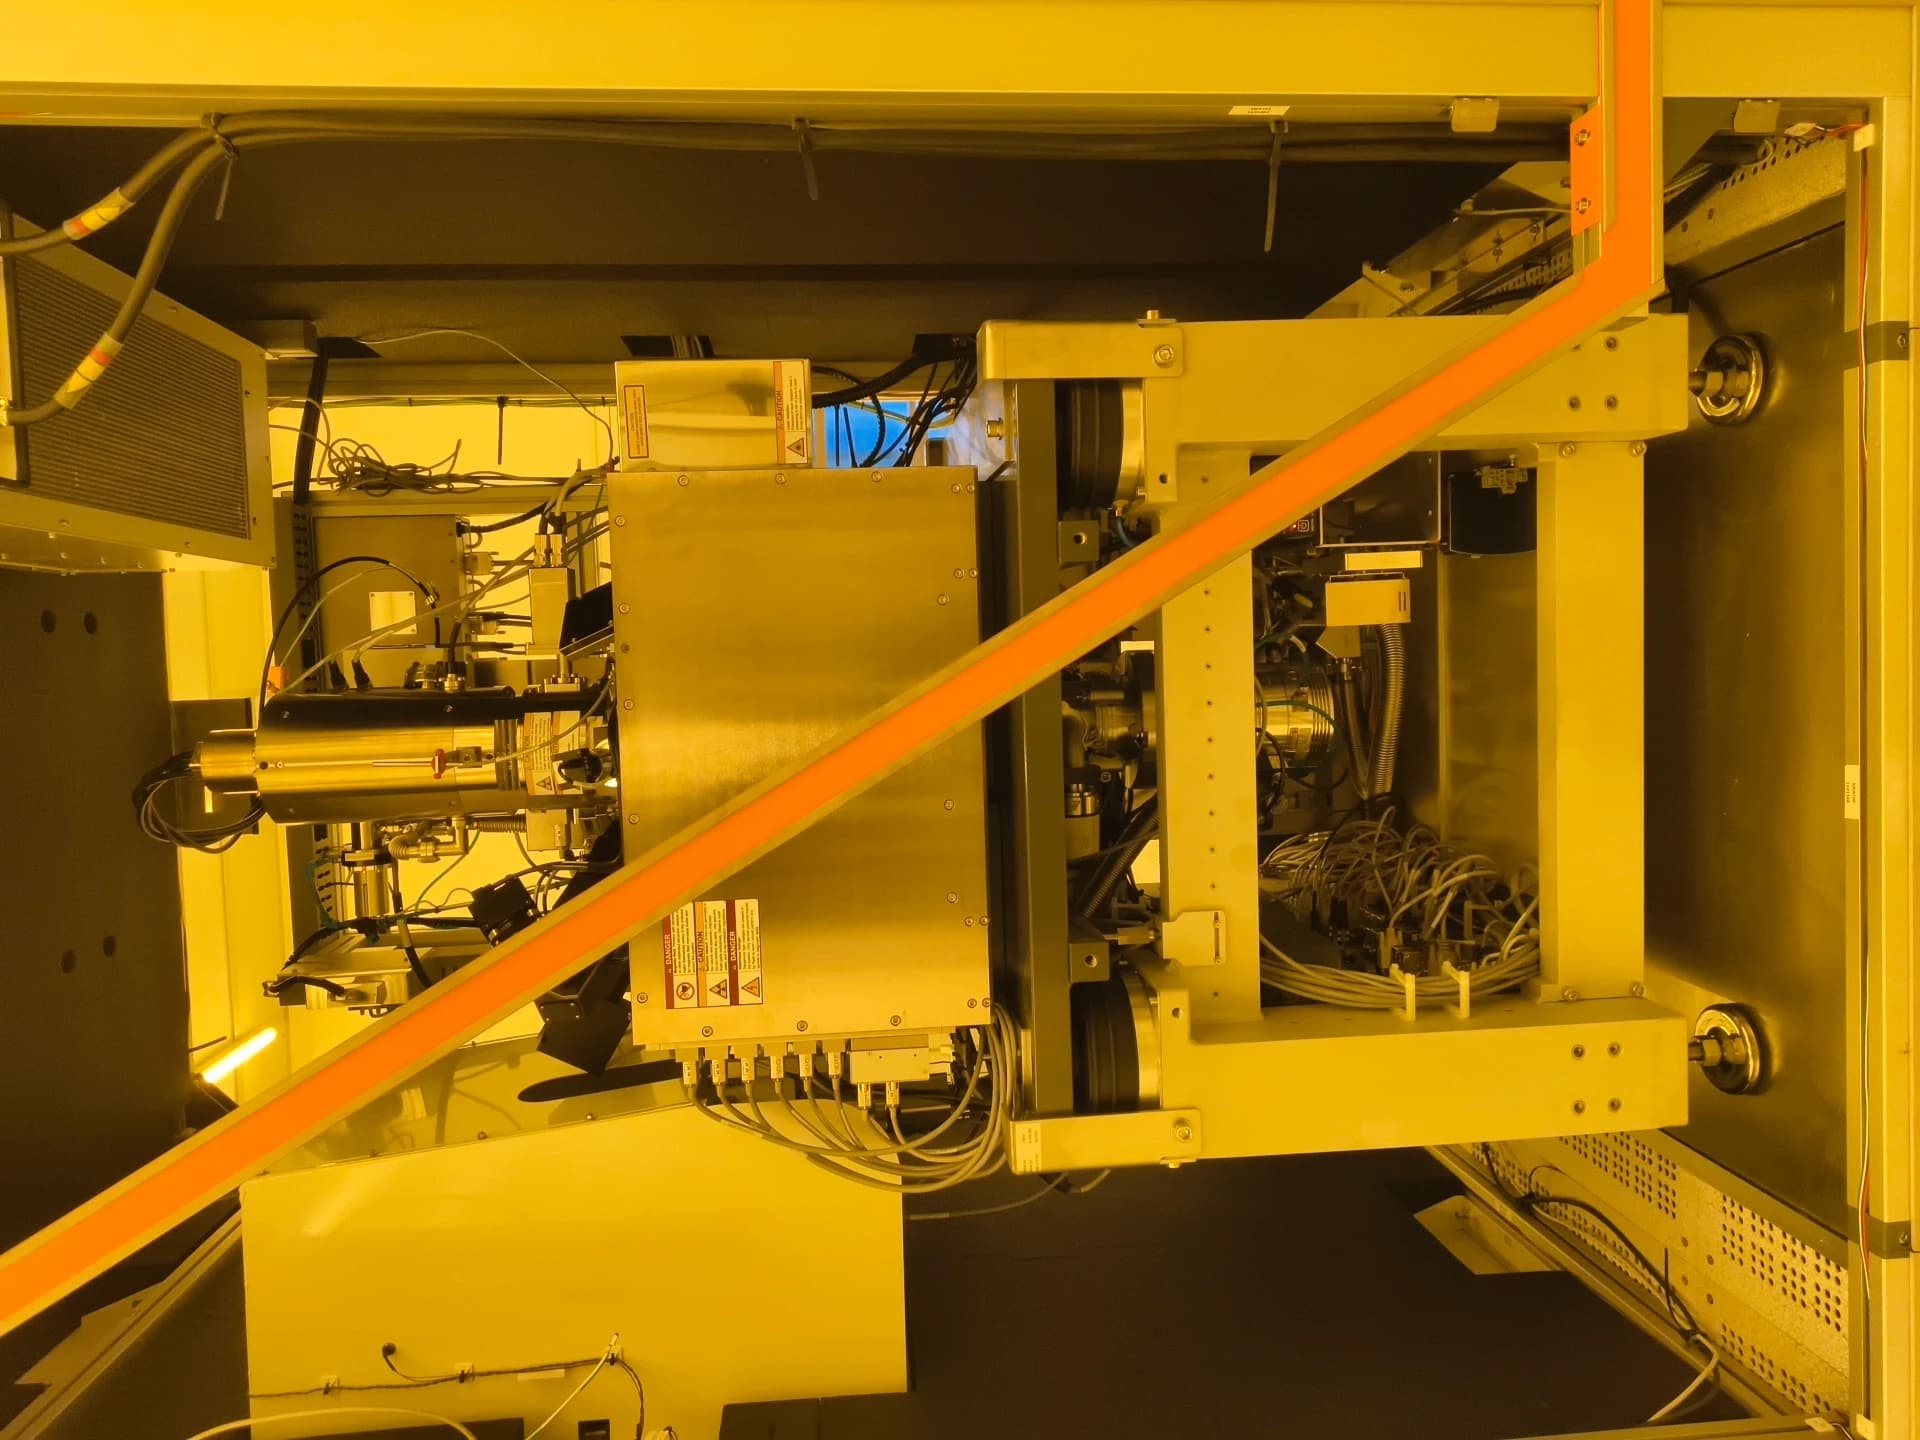
RAITH Voyager E-Beam DVIA-ML1000 Installation Report
DVIA-ML1000 installation report (serial 260422R1-1) for a RAITH Voyager E-Beam system in Suzhou, supplied for end user Dingxin Optoelectronics Technology. Tuning was performed on 2026.08.27 with the equipment idle; the Vertical and Front-to-Back axes met the vibration specification while the Left-to-Right axis remained out of compliance due to a resonance near 9 Hz.
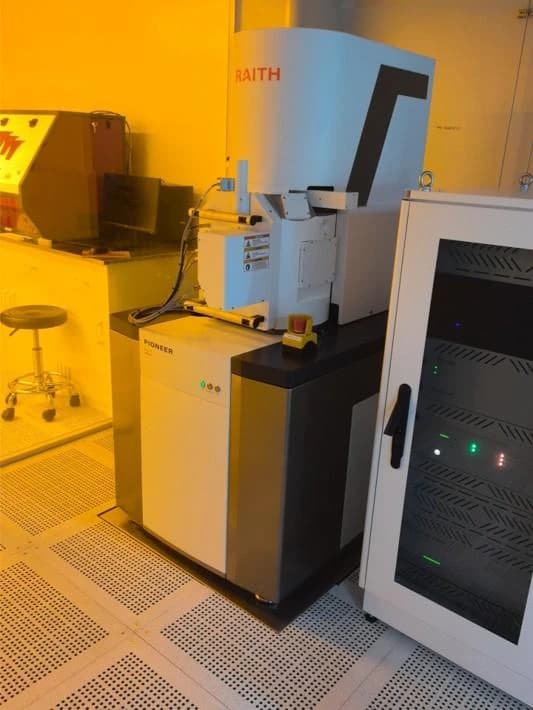
Hubei University of Technology RAITH Electron Beam Lithography Pioneer Two DVIA-ML1000 Installation Report
DVIA-ML1000 installation report (serial 260209R6) for a RAITH Electron Beam Lithography (Pioneer Two) installed at Hubei University of Technology, Wuhan. Tuning was carried out on 2026.08.25 and vibration was measured with the equipment in the Turned off state. The system provided effective attenuation across the frequency bands where meaningful floor vibration is present, and the site was confirmed suitable for equipment operation.