ASE Korea TESCAN FIB-SEM SOLARIS X2 GMH DVIA-ML1000 Installation Report
Contents
Overview
Following the installation of DVIA-ML1000 at ASE Korea PB1, 1CMD QO Lab, Electron Microscopy Room, tuning and vibration measurement were performed.
Inspection and vibration measurement were conducted with the equipment in the IDLE state.
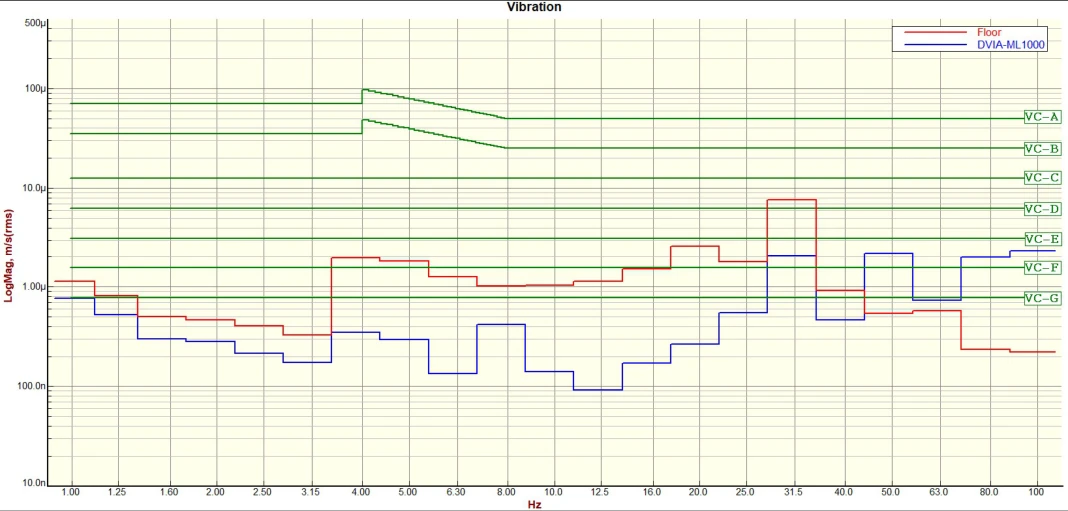
Data is represented in VC Curve format and reference material on the vibration level is provided.
Vibration Isolation System Information
Model: DVIA-ML1000
Serial Number: 260622R4
Engineer
Gyumin Park · DAEIL SYSTEMS
Tuning Date
2026.09.11
Site
ASE Korea PB1, 1CMD QO Lab, Electron Microscopy Room
End User
ASE Korea
Customer Equipment
Manufacturer: TESCAN
Equipment: FIB-SEM
Model: SOLARIS X2 GMH
Vibration Specification
Horizontal
| Frequency [Hz] | Spec [µm/s RMS] |
|---|---|
| 1 | 10 |
| 30 | 10 |
| 30 | 20 |
| 100 | 20 |
Vertical
| Frequency [Hz] | Spec [µm/s RMS] |
|---|---|
| 1 | 10 |
| 30 | 10 |
| 30 | 20 |
| 100 | 20 |
Equipment Condition
IDLE
Vibration Measurement Equipment
10.1) Measurement Equipment
Hardware: B&K Front End Type 3040-A-040
Software: B&K Pulse Labshop22 Version
10.2) Accelerometer
PCB 393B05
Vibration Measurement Setup
F Span: 200 Hz
Lines: 2400
Engineering Units: m/s
Window: Hanning
Averaging: FFT Spectrum Averaging
Conclusion
As a result of tuning the vibration isolation platform below the TESCAN FIB-SEM equipment in the ASE Paju microscopy laboratory and performing the vibration measurement, all axes met the reference specification and achieved a "PASS" rating. The measurement results showed that the vertical axis improved from VC-B to VC-E, the left-to-right axis from VC-E to VC-G, and the front-to-back axis from VC-B to VC-F. After tuning, the equipment image performance was verified and no abnormalities were finally confirmed, establishing an optimal vibration environment for high-precision analysis.
Measurement Data Summary
| Measurement Location | Vibration Spec | Measured Axis | Measurement Result | |
|---|---|---|---|---|
| Floor | DVIA-ML1000 | |||
| 1. Floor 2. DVIA-ML1000 | See Section 8 | Vertical (Z-axis) | ✓ PASS | ✓ PASS |
| Left to Right (X-axis) | ✓ PASS | ✓ PASS | ||
| Front to Back (Y-axis) | ✓ PASS | ✓ PASS | ||
Measurement Data
Vertical (Z-axis)
Z-axis — Autospectrum
Z-axis — VC Curves
Left to Right (X-axis)
X-axis — Autospectrum
X-axis — VC Curves
Front to Back (Y-axis)
Y-axis — Autospectrum
Y-axis — VC Curves
Reference
The table below classifies vibration levels based on IEST-RP-CC012.2.
Notes:
1. As measured in one-third octave bands of frequency over the frequency 8 to 80 Hz (VC-A and VC-B) or 1 to 80 Hz (VC-C through VC-G).
2. The detail size refers to the width in the case of microelectronics fabrication, the particle (cell) size in the case of medical and pharmaceutical research, etc. It is to imaging associated with probe technologies, AFMs, and nanotechnology.
The information given in this table is for guidance only. In most instances, it is recommended that the advice of someone knowledgeable about applications and vibration requirements of the equipment and processes be sought.
Share this Case Study
Case Study Information
Related Case Studies
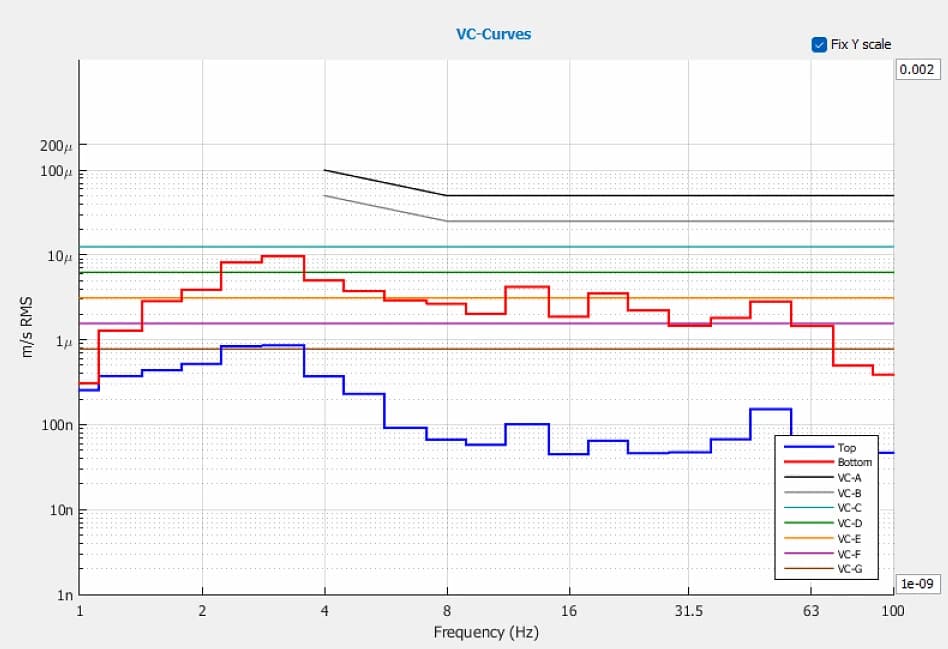
TF AMD Microelectronics Penang TESCAN AMBER X GMH FIB-SEM DVIA-ML1000 Installation Report
Jiasheng Advanced Technology TESCAN Amber FIB-SEM DVIA-ML1000 (251117R7) Installation Report