Hubei University of Technology RAITH Electron Beam Lithography Pioneer Two DVIA-ML1000 Installation Report
Contents
Overview
Following the installation of DVIA-ML1000 at Wuhan, tuning and vibration measurement were performed.
Vibration measurement was conducted with the equipment in the Turned off state.
Data is represented in Autospectrum and reference material on the vibration level is provided.
Vibration Isolation System Information
Model: DVIA-ML1000
Serial Number: 260209R6
Engineer
Taehun Kim · DAEIL SYSTEMS
Tuning Date
2026.08.25
End User
Hubei University of Technology
Number of Tuning Trial
1st
Site
Wuhan
Equipment
Manufacturer: RAITH
Equipment: Electron Beam Lithography
Model: Pioneer Two
Vibration Specification
Horizontal
| Frequency [Hz] | Allowable [µm/s RMS] |
|---|---|
| 1 | 0.8 |
| 16 | 0.8 |
| 16 | 1 |
| 100 | 1 |
Vertical
| Frequency [Hz] | Allowable [µm/s RMS] |
|---|---|
| 1 | 0.8 |
| 16 | 0.8 |
| 16 | 1 |
| 100 | 1 |
Equipment Condition
Turned off
Tuning Request
Conclusion
The vibration measurements confirm that the DVIA-ML1000 active vibration isolation system provides effective attenuation across the frequency bands where meaningful floor vibration is present.
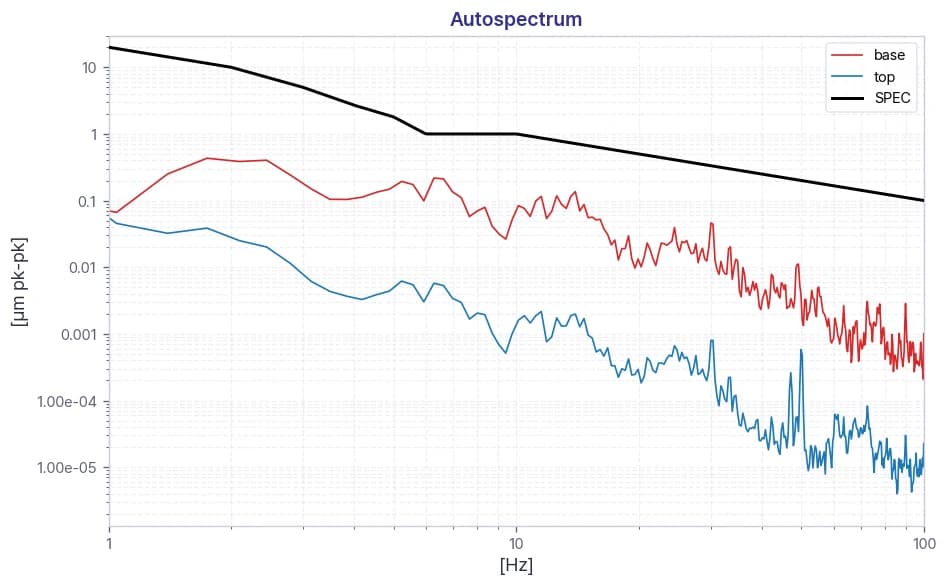
In the horizontal (X and Y) axes, the ambient floor vibration in the 1–2 Hz range is exceptionally low, approaching the noise floor of the measurement system. As a result, the transmissibility data in this narrow band indicates a slight amplification relative to the floor input. It should be noted, however, that the absolute vibration amplitude in this region remains on the order of tens of nanometers, which is well below the threshold at which any measurable effect on the imaging or lithography performance of the RAITH PIONEER SEM would be expected. This behavior is characteristic of active isolation systems operating in an environment where the input excitation is near the measurement resolution limit, and it does not represent a deficiency in isolation performance.
Across all frequency bands in which identifiable floor vibration is present, the system demonstrates clear and consistent attenuation, confirming that the installation meets the intended isolation objectives. The site is therefore considered suitable for the operation of the installed equipment.
Measurement Summary
| Measurement Point | Vibration Specifications | Axis | Result | |
|---|---|---|---|---|
| Floor | DVIA-ML1000 | |||
| 1. Floor 2. DVIA-ML1000 | See Section 9 | Vertical | ✗ FAIL | ✓ PASS |
| Left to Right | ✓ PASS | ✓ PASS | ||
| Front to Back | ✓ PASS | ✓ PASS | ||
Measurement Data Obtained via UI Program
Vertical
Vertical — Autospectrum
Left to Right
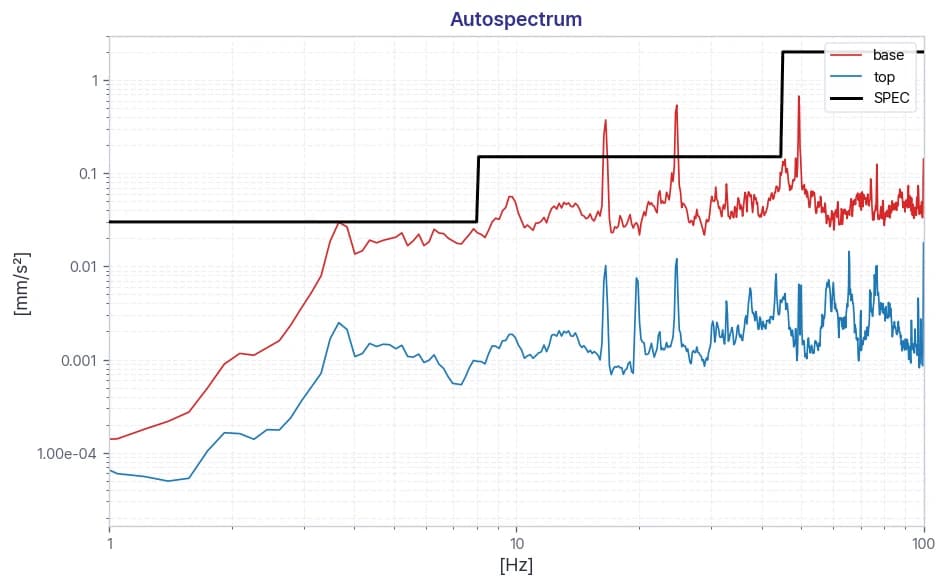
Left to Right — Autospectrum
Front to Back
Front to Back — Autospectrum
Installation Photo
Equipment
Reference
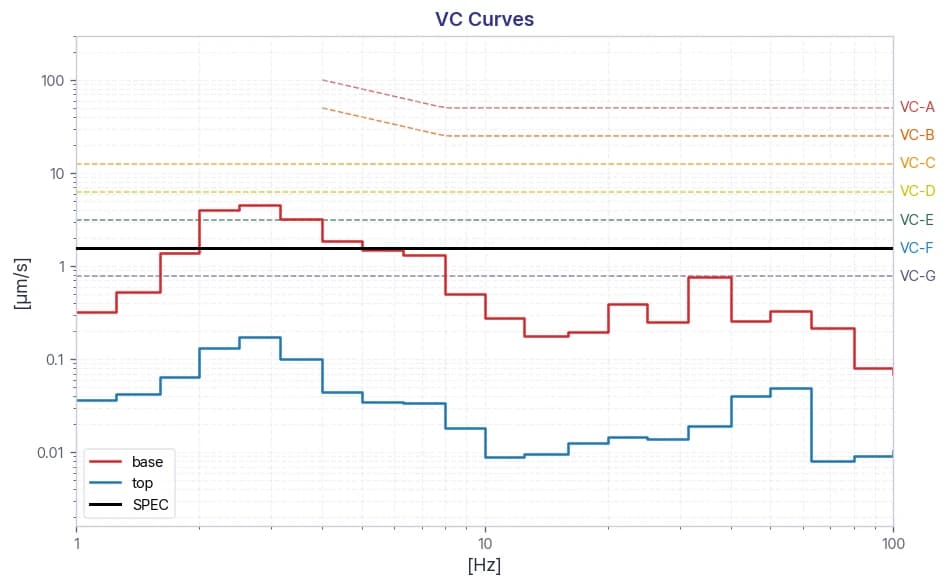
The table below classifies vibration levels based on IEST-RP-CC012.2.
Notes:
1. As measured in one-third octave bands of frequency over the frequency 8 to 80 Hz (VC-A and VC-B) or 1 to 80 Hz (VC-C through VC-G).
2. The detail size refers to the width in the case of microelectronics fabrication, the particle (cell) size in the case of medical and pharmaceutical research, etc. It is to imaging associated with probe technologies, AFMs, and nanotechnology.
The information given in this table is for guidance only. In most instances, it is recommended that the advice of someone knowledgeable about applications and vibration requirements of the equipment and processes be sought.
Share this Case Study
Case Study Information
Related Case Studies
YIMOTECH Resonac Electronic Materials ZEISS Sigma 360 FE-SEM DVIA-ML1000 Installation Report
YIMOTECH Thermo Fisher Quattro ESEM DVIA-ML1000 Installation Report