Quantum Photonics Research Laboratory attocube attoDRY1000/SU Cryostat DVIA-ML1000 Installation Report
Contents
Overview
A DVIA-ML1000 active vibration isolation system (non-magnetic cover, external controller) was installed at Quantum Photonics Research Laboratory, Copenhagen, Denmark, followed by tuning and vibration measurement.
The isolator was verified after installation with the customer cryostat seated on the top plate, powered off and with external vibration disturbance kept to a minimum. Vibration on the isolator top plate met the customer requirement of VC-E on all axes.
Data are presented as VC curves, autospectra and transfer rate, with reference material on vibration levels.
Vibration Isolation System Information
Model: DVIA-ML1000 (non-magnetic cover, 1300 × 750 × 173H mm, External Controller)
Engineer
Kyeongdan Kim · DAEIL SYSTEMS
Installation Date
2026.09.22 – 23
Report Written Date
2026.10.05
Tuning Date
2026.09.22
Location
Copenhagen, Denmark
End User
Quantum Photonics Research Laboratory, Copenhagen, Denmark
Equipment
Manufacturer: attocube systems AG
Equipment: Closed-cycle cryostat (pulse-tube, top-loading)
Model: attoDRY1000/SU
Vibration Specification
VC-E (3.12 µm/s, 1/3-octave bands, 1–80 Hz, all axes)
— the level set by the customer, based on their experience that image quality was sufficient when measuring on a floor at VC-E.
This is a customer requirement, not a specification of the equipment manufacturer.
The VC reference curves and the values for each grade are given in Section 14, Reference.
Equipment Condition
Cryostat seated on the isolator top plate with the optical breadboard mounted; cryostat powered off, helium compressor stopped. Only the helium flex line to the service-unit cabinet was connected.
Engineering Tool & Setup
Measurement equipment
| Item | UI (isolator built-in sensors) |
|---|---|
| Instrument · software | DVIA-ML1000 controller · DAEIL SYSTEMS Tuning Software DVIA-ML/ULF (6 DOF) Ver 2.0.2 |
| Sensors | Isolator built-in velocity sensors (Top / Bottom) |
| Channels | Top = isolator top plate Bottom = isolator base |
Measurement setup
| Item | UI |
|---|---|
| Frequency span | Sampling 714.2 Hz · frequency range 250 Hz |
| FFT / window | FFT 4096 · Hanning |
| Averaging | 100 · overlap 99 % |
| Engineering unit | m/s RMS |
Axis definition
| Axis | Direction |
|---|---|
| X | Along the long side of the isolator (1300 mm) |
| Y | Along the short side (750 mm) |
| Z | Vertical |
Conclusion
Under the acceptance condition of 2026.09.22 (a-0), vibration on the DVIA-ML1000 top plate was VC-G on Z, VC-G on X and VC-E on Y, meeting the customer requirement of VC-E on all axes. At the same time the base measured VC-C on Z, VC-F on X and VC-F on Y.
The installation and tuning of the DVIA-ML1000 therefore satisfy the customer requirement.
Measurement Summary
Grades are based on the maximum 1/3-octave value from 1 to 80 Hz.
| Measurement Point | Requirement | Axis | Measurement Data | Result (top plate) | |
|---|---|---|---|---|---|
| Base | DVIA-ML1000 top plate | ||||
| 1. Base 2. DVIA-ML1000 top plate | VC-E | Vertical (Z) | VC-C | VC-G | ✓ PASS |
| Left–Right (X) | VC-F | VC-G | ✓ PASS | ||
| Front–Back (Y) | VC-F | VC-E | ✓ PASS | ||
Measurement Data
a-0: UI measurement after tuning on 09.22 (Active).
One page per axis — VC curves / autospectrum / transfer rate. Blue = Top (top plate), red = Bottom (base).
Left–Right (X, long side 1300 mm)
a-0 – X – VC curves (Top = top plate, Bottom = base)
a-0 – X – Autospectrum
a-0 – X – Transfer rate (gain dB · time waveform)
Front–Back (Y, short side 750 mm)
a-0 – Y – VC curves (Top = top plate, Bottom = base)
a-0 – Y – Autospectrum
a-0 – Y – Transfer rate (gain dB · time waveform)
Vertical (Z)
a-0 – Z – VC curves (Top = top plate, Bottom = base)
a-0 – Z – Autospectrum
a-0 – Z – Transfer rate (gain dB · time waveform)
Reference
The table below classifies vibration levels based on IEST-RP-CC012.2.
¹ As measured in one-third octave bands of frequency over the frequency 8 to 80 Hz (VC-A and VC-B) or 1 to 80 Hz (VC-C through VC-G).
² The detail size refers to the width in the case of microelectronics fabrication, the particle (cell) size in the case of medical and pharmaceutical research, etc. It is to imaging associated with probe technologies, AFMs, and nanotechnology.
The information given in this table is for guidance only. In most instances, it is recommended that the advice of someone knowledgeable about applications and vibration requirements of the equipment and processes be sought.
Share this Case Study
Case Study Information
Related Case Studies
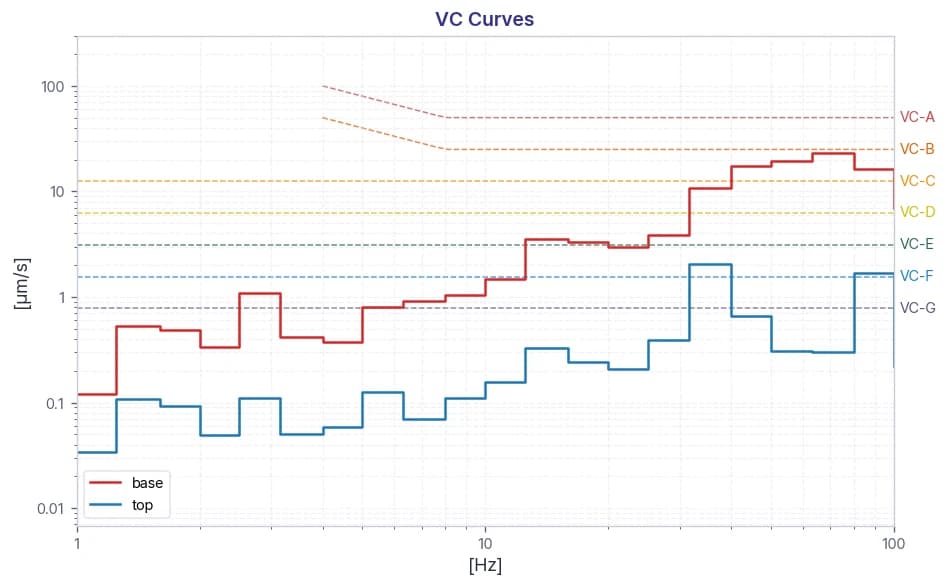
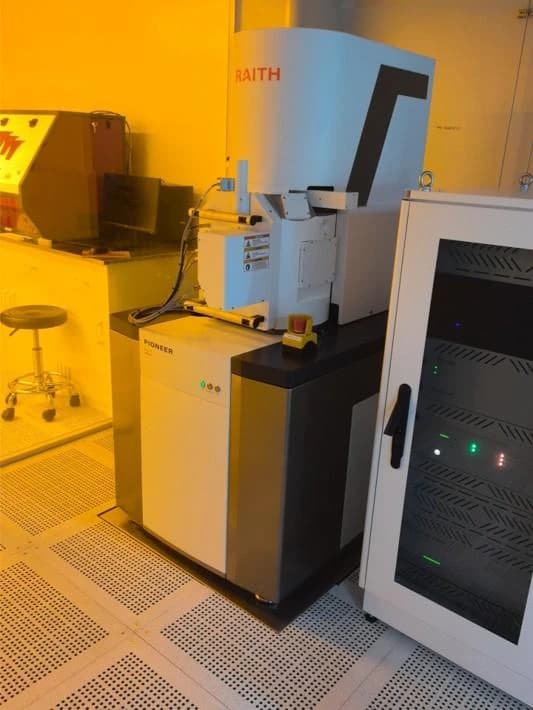
ASE Korea TESCAN FIB-SEM SOLARIS X2 GMH DVIA-ML1000 Installation Report
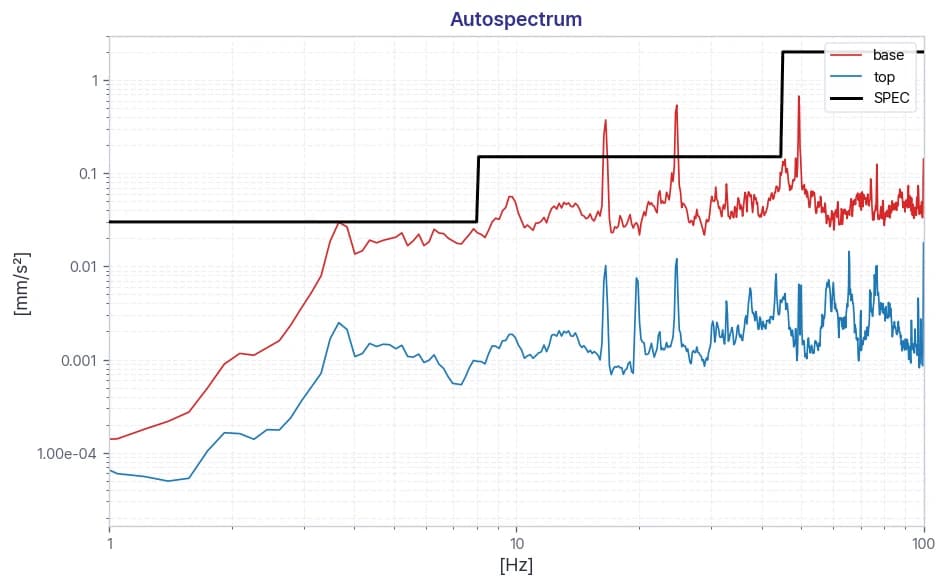
Resonac Electronic Materials ZEISS Sigma 360 FE-SEM DVIA-ML1000 Installation Report