ZEISS Gemini SEM 460 DVIA-ML1000 Installation Report
Contents
Overview
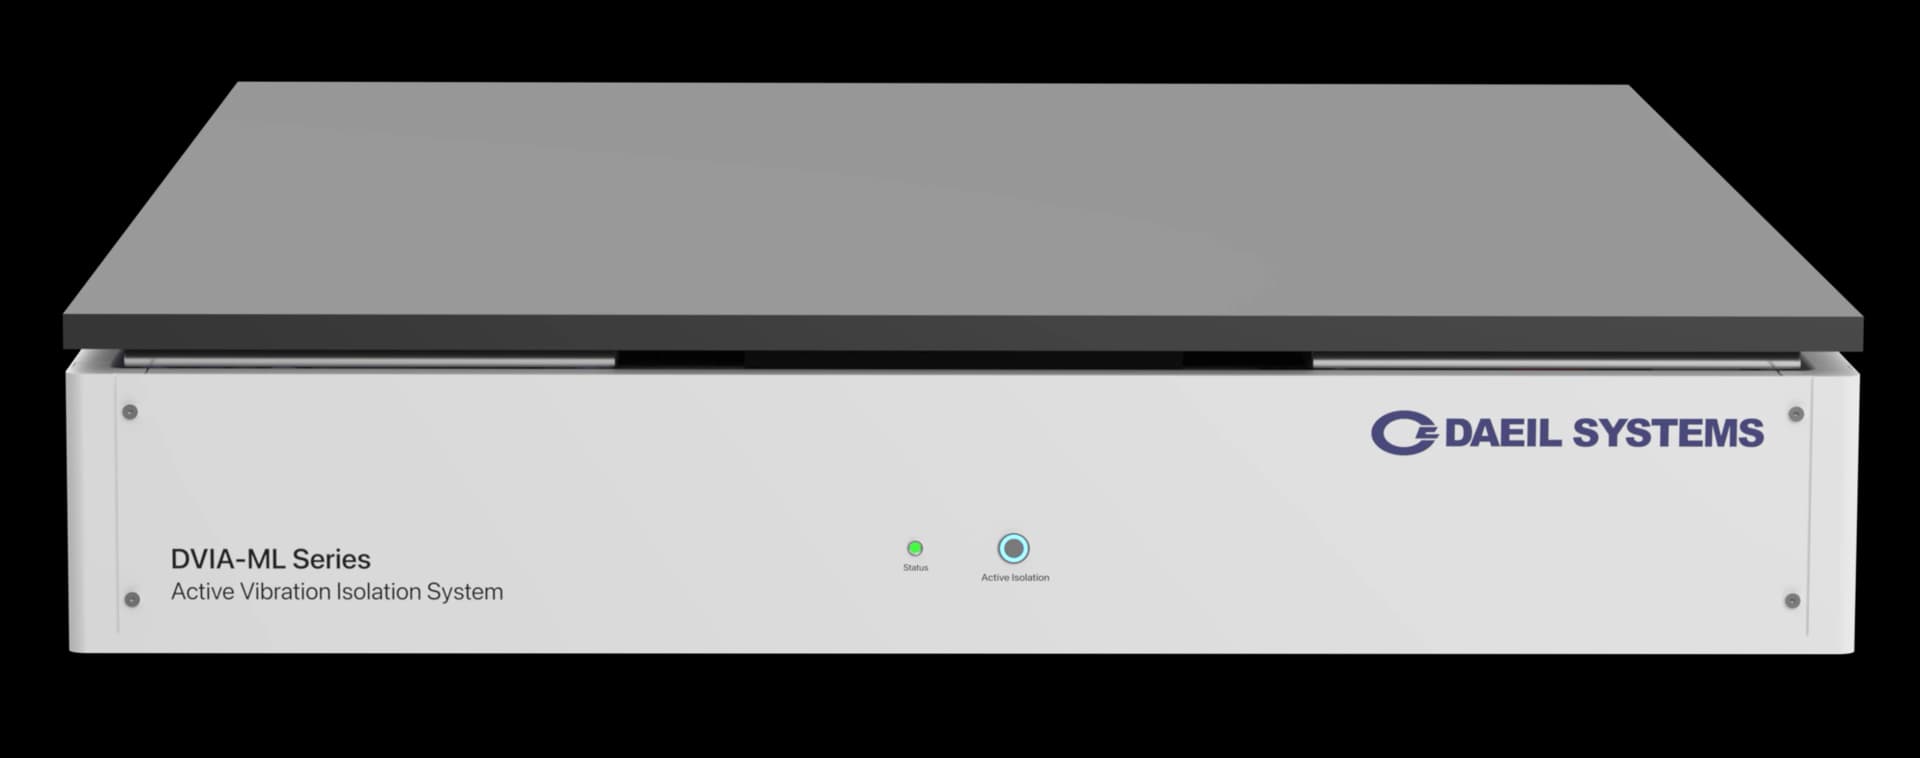
Tuning was performed on the DVIA-ML1000 vibration isolation system for the ZEISS Gemini SEM 460 in the 4 Line analysis room of the Tier-1 Semiconductor Onyang site, and the top-plate vibration was inspected on the X/Y/Z axes against the ZEISS installation requirements (Section 9).
Measurement was conducted with the customer equipment Turned On and the isolation system Active ON (tuning completed). Evaluation is based on the vibration spectrum (Autospectrum, 0.5 Hz resolution, µm/s rms), the same basis as the Section 9 specification.
Vibration Isolation System Information
Model: DVIA-ML1000
Serial Number: 260529R6
Engineer
Donggyu Park · Changhyeon Moon · DAEIL SYSTEMS
Tuning Date
2026.11.02
End User
Tier-1 Semiconductor Onyang
Number of Tuning Trial
1st
Site
Asan, Chungnam / Tier-1 Semiconductor Onyang site / 4 Line 4F analysis room
Equipment
Manufacturer: ZEISS
Equipment: FE-SEM
Model: Gemini SEM 460
Vibration Specification
Applied standard: ZEISS Gemini SEM Installation Requirements (Installation Requirements ZEISS Gemini SEM, 2.1.6 Vibrations)
| Axis | Frequency Band | Allowable [µm/s rms] |
|---|---|---|
| Horizontal (X · Y) | ≤ 10 Hz | < 5 |
| 10 ~ 60 Hz | < 10 | |
| > 60 Hz | < 14 | |
| Vertical (Z) | ≤ 10 Hz | < 4 |
| 10 ~ 60 Hz | < 14 | |
| > 60 Hz | < 20 |
Criterion: Pass if the vibration spectrum (0.5 Hz resolution) of each X/Y/Z axis is below the allowable value of each frequency band over the measurement range (1.05 ~ 100 Hz).
Equipment Condition
Turned On
Measurement Equipment · Setup
| Item | UI (built-in sensors of the isolation system) |
|---|---|
| Instrument · Software | DVIA-ML built-in control boards · DAEIL SYSTEMS Tuning Software DVIA-ML/ULF (6 DOF) Ver 2.0.2 |
| Sensor | Built-in geophones (velocity sensors, Top / Bottom) |
| Measurement Point | P1 isolation system bottom plate / P2 isolation system top plate — 2-channel simultaneous measurement |
| Measurement Axis | X (left-right) / Y (front-back) / Z (vertical) — measured sequentially per axis |
| Frequency Span | Sampling 714.2 Hz · Freq range 250 Hz |
| FFT / Window | FFT 4096 points (Z) · 8192 points (X · Y) · Hanning |
| Resolution | Δf 0.174 Hz (Z) · 0.087 Hz (X · Y) · evaluation converted to 0.5 Hz (sum of spectrum within ±0.25 Hz of each frequency ÷ 1.5, Hanning window correction) · data range 1.05 ~ 100 Hz |
| Averaging | Average |
| Engineering Unit | m/s RMS (converted to µm/s in graphs · tables) |
| Measurement Condition | Customer equipment Turned On · isolation system Active ON (tuning completed) · ambient · average · 3 times per axis · 11:00 ~ 16:00 |
Conclusion
1) After tuning the DVIA-ML1000, the top-plate vibration is within the ZEISS Gemini SEM installation requirements (Section 9) on all three X/Y/Z axes. The maximum per axis is Vertical (Z) 0.85 µm/s rms @ 13.4 Hz (allowable < 14), Left-Right (X) 1.85 µm/s rms @ 1.2 Hz (allowable < 5), and Front-Back (Y) 1.83 µm/s rms @ 1.2 Hz (allowable < 5).
2) The simultaneously measured bottom plate exceeded the allowable values of the respective bands at Vertical (Z) ≤10 Hz 7.63 µm/s rms @ 2.8 Hz, Vertical (Z) 10~60 Hz 24.28 µm/s rms @ 13.4 Hz, and Front-Back (Y) ≤10 Hz 7.69 µm/s rms @ 1.2 Hz, while the top plate in the same bands is within the allowable values.
Measurement Summary
| Axis | Frequency Band | Allowable | Bottom Plate | Top Plate (DVIA-ML1000) | Result (Bottom) | Result (Top) |
|---|---|---|---|---|---|---|
| Vertical (Z) | ≤ 10 Hz | < 4 | 7.63 @ 2.8 Hz | 0.65 @ 2.6 Hz | ✗ FAIL | ✓ PASS |
| 10 ~ 60 Hz | < 14 | 24.28 @ 13.4 Hz | 0.85 @ 13.4 Hz | ✗ FAIL | ✓ PASS | |
| > 60 Hz | < 20 | 1.48 @ 92.6 Hz | 0.22 @ 72.4 Hz | ✓ PASS | ✓ PASS | |
| Left to Right (X) | ≤ 10 Hz | < 5 | 4.82 @ 1.2 Hz | 1.85 @ 1.2 Hz | ✓ PASS | ✓ PASS |
| 10 ~ 60 Hz | < 10 | 2.44 @ 58.9 Hz | 0.25 @ 31.8 Hz | ✓ PASS | ✓ PASS | |
| > 60 Hz | < 14 | 0.26 @ 60.1 Hz | 0.13 @ 64.6 Hz | ✓ PASS | ✓ PASS | |
| Front to Back (Y) | ≤ 10 Hz | < 5 | 7.69 @ 1.2 Hz | 1.83 @ 1.2 Hz | ✗ FAIL | ✓ PASS |
| 10 ~ 60 Hz | < 10 | 3.09 @ 18.6 Hz | 0.31 @ 14.6 Hz | ✓ PASS | ✓ PASS | |
| > 60 Hz | < 14 | 0.18 @ 92.8 Hz | 0.14 @ 76.5 Hz | ✓ PASS | ✓ PASS |
Results are the maximum of the vibration spectrum (converted to 0.5 Hz resolution) in each frequency band, in µm/s rms. The bottom and top plates are each evaluated against the Section 9 allowable values.
Measurement Data
For each axis, the Autospectrum (converted to 0.5 Hz — ZEISS allowable values from Section 9 shown as the SPEC line) and VC Curves (1/3 octave, reference) are shown. Evaluation follows Section 13; VC Curves are not used for evaluation.
Vertical (Z-axis)
Vertical (Z-axis) — Autospectrum (0.5 Hz converted, SPEC: ZEISS Gemini SEM allowable)
Vertical (Z-axis) — VC Curves (1/3 octave) — reference only, not used for evaluation
Left to Right (X-axis)
Left to Right (X-axis) — Autospectrum (0.5 Hz converted, SPEC: ZEISS Gemini SEM allowable)
Left to Right (X-axis) — VC Curves (1/3 octave) — reference only, not used for evaluation
Front to Back (Y-axis)
Front to Back (Y-axis) — Autospectrum (0.5 Hz converted, SPEC: ZEISS Gemini SEM allowable)
Front to Back (Y-axis) — VC Curves (1/3 octave) — reference only, not used for evaluation
Installation Photo
Photo Not Allowed
On-site photography was not permitted, so the installation status is described instead of photos. The DVIA-ML1000 isolation system is installed on the floor of the 4F analysis room, and the ZEISS Gemini SEM 460 is seated at the center of the isolation system top plate. The measurement points are the two built-in sensor locations of the isolation system: top plate (Top) and bottom plate (Bottom).
Reference
The table below classifies vibration levels based on IEST-RP-CC012.2.
The evaluation in this report follows the ZEISS installation requirements in Section 9 (0.5 Hz resolution); the VC classification below is for vibration-level reference only.
Notes:
1. As measured in one-third octave bands of frequency over the frequency 8 to 80 Hz (VC-A and VC-B) or 1 to 80 Hz (VC-C through VC-G).
2. The detail size refers to the width in the case of microelectronics fabrication, the particle (cell) size in the case of medical and pharmaceutical research, etc. It is not relevant to imaging associated with probe technologies, AFMs, and nanotechnology.
The information given in this table is for guidance only. In most instances, it is recommended that the advice of someone knowledgeable about applications and vibration requirements of the equipment and processes be sought.
Share this Case Study
Case Study Information
Related Case Studies

Tier-1 Semiconductor Pyeongtaek P1 ZEISS Gemini SEM 460 DVIA-ML1000 Installation Report
Tier-1 Semiconductor Cheonan C5 ZEISS Versa Gemini SEM 460 DVIA-ML1000 Installation Report
