Vibration Isolation Case Studies
DAEIL SYSTEMS engineers active vibration isolation systems for the world's most demanding nanoscale imaging and metrology environments.
Series
Equipment Type
Manufacturer
Filtered Case Studies
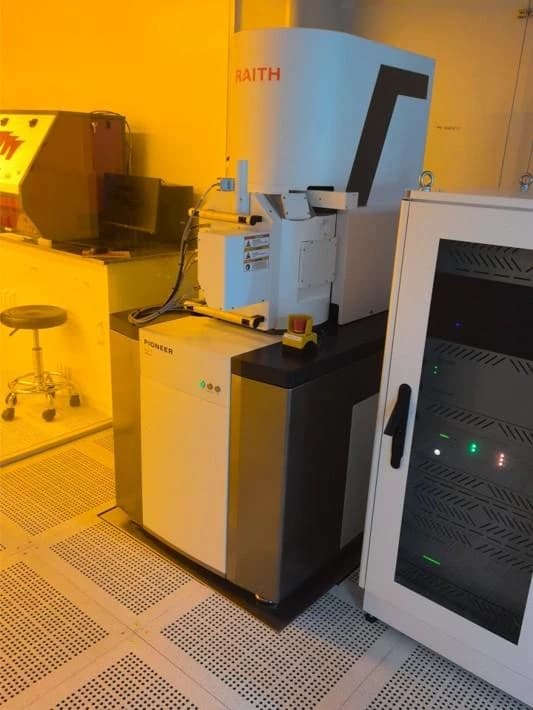
Hubei University of Technology RAITH Electron Beam Lithography Pioneer Two DVIA-ML1000 Installation Report
DVIA-ML1000 installation report (serial 260209R6) for a RAITH Electron Beam Lithography (Pioneer Two) installed at Hubei University of Technology, Wuhan. Tuning was carried out on 2026.08.25 and vibration was measured with the equipment in the Turned off state. The system provided effective attenuation across the frequency bands where meaningful floor vibration is present, and the site was confirmed suitable for equipment operation.
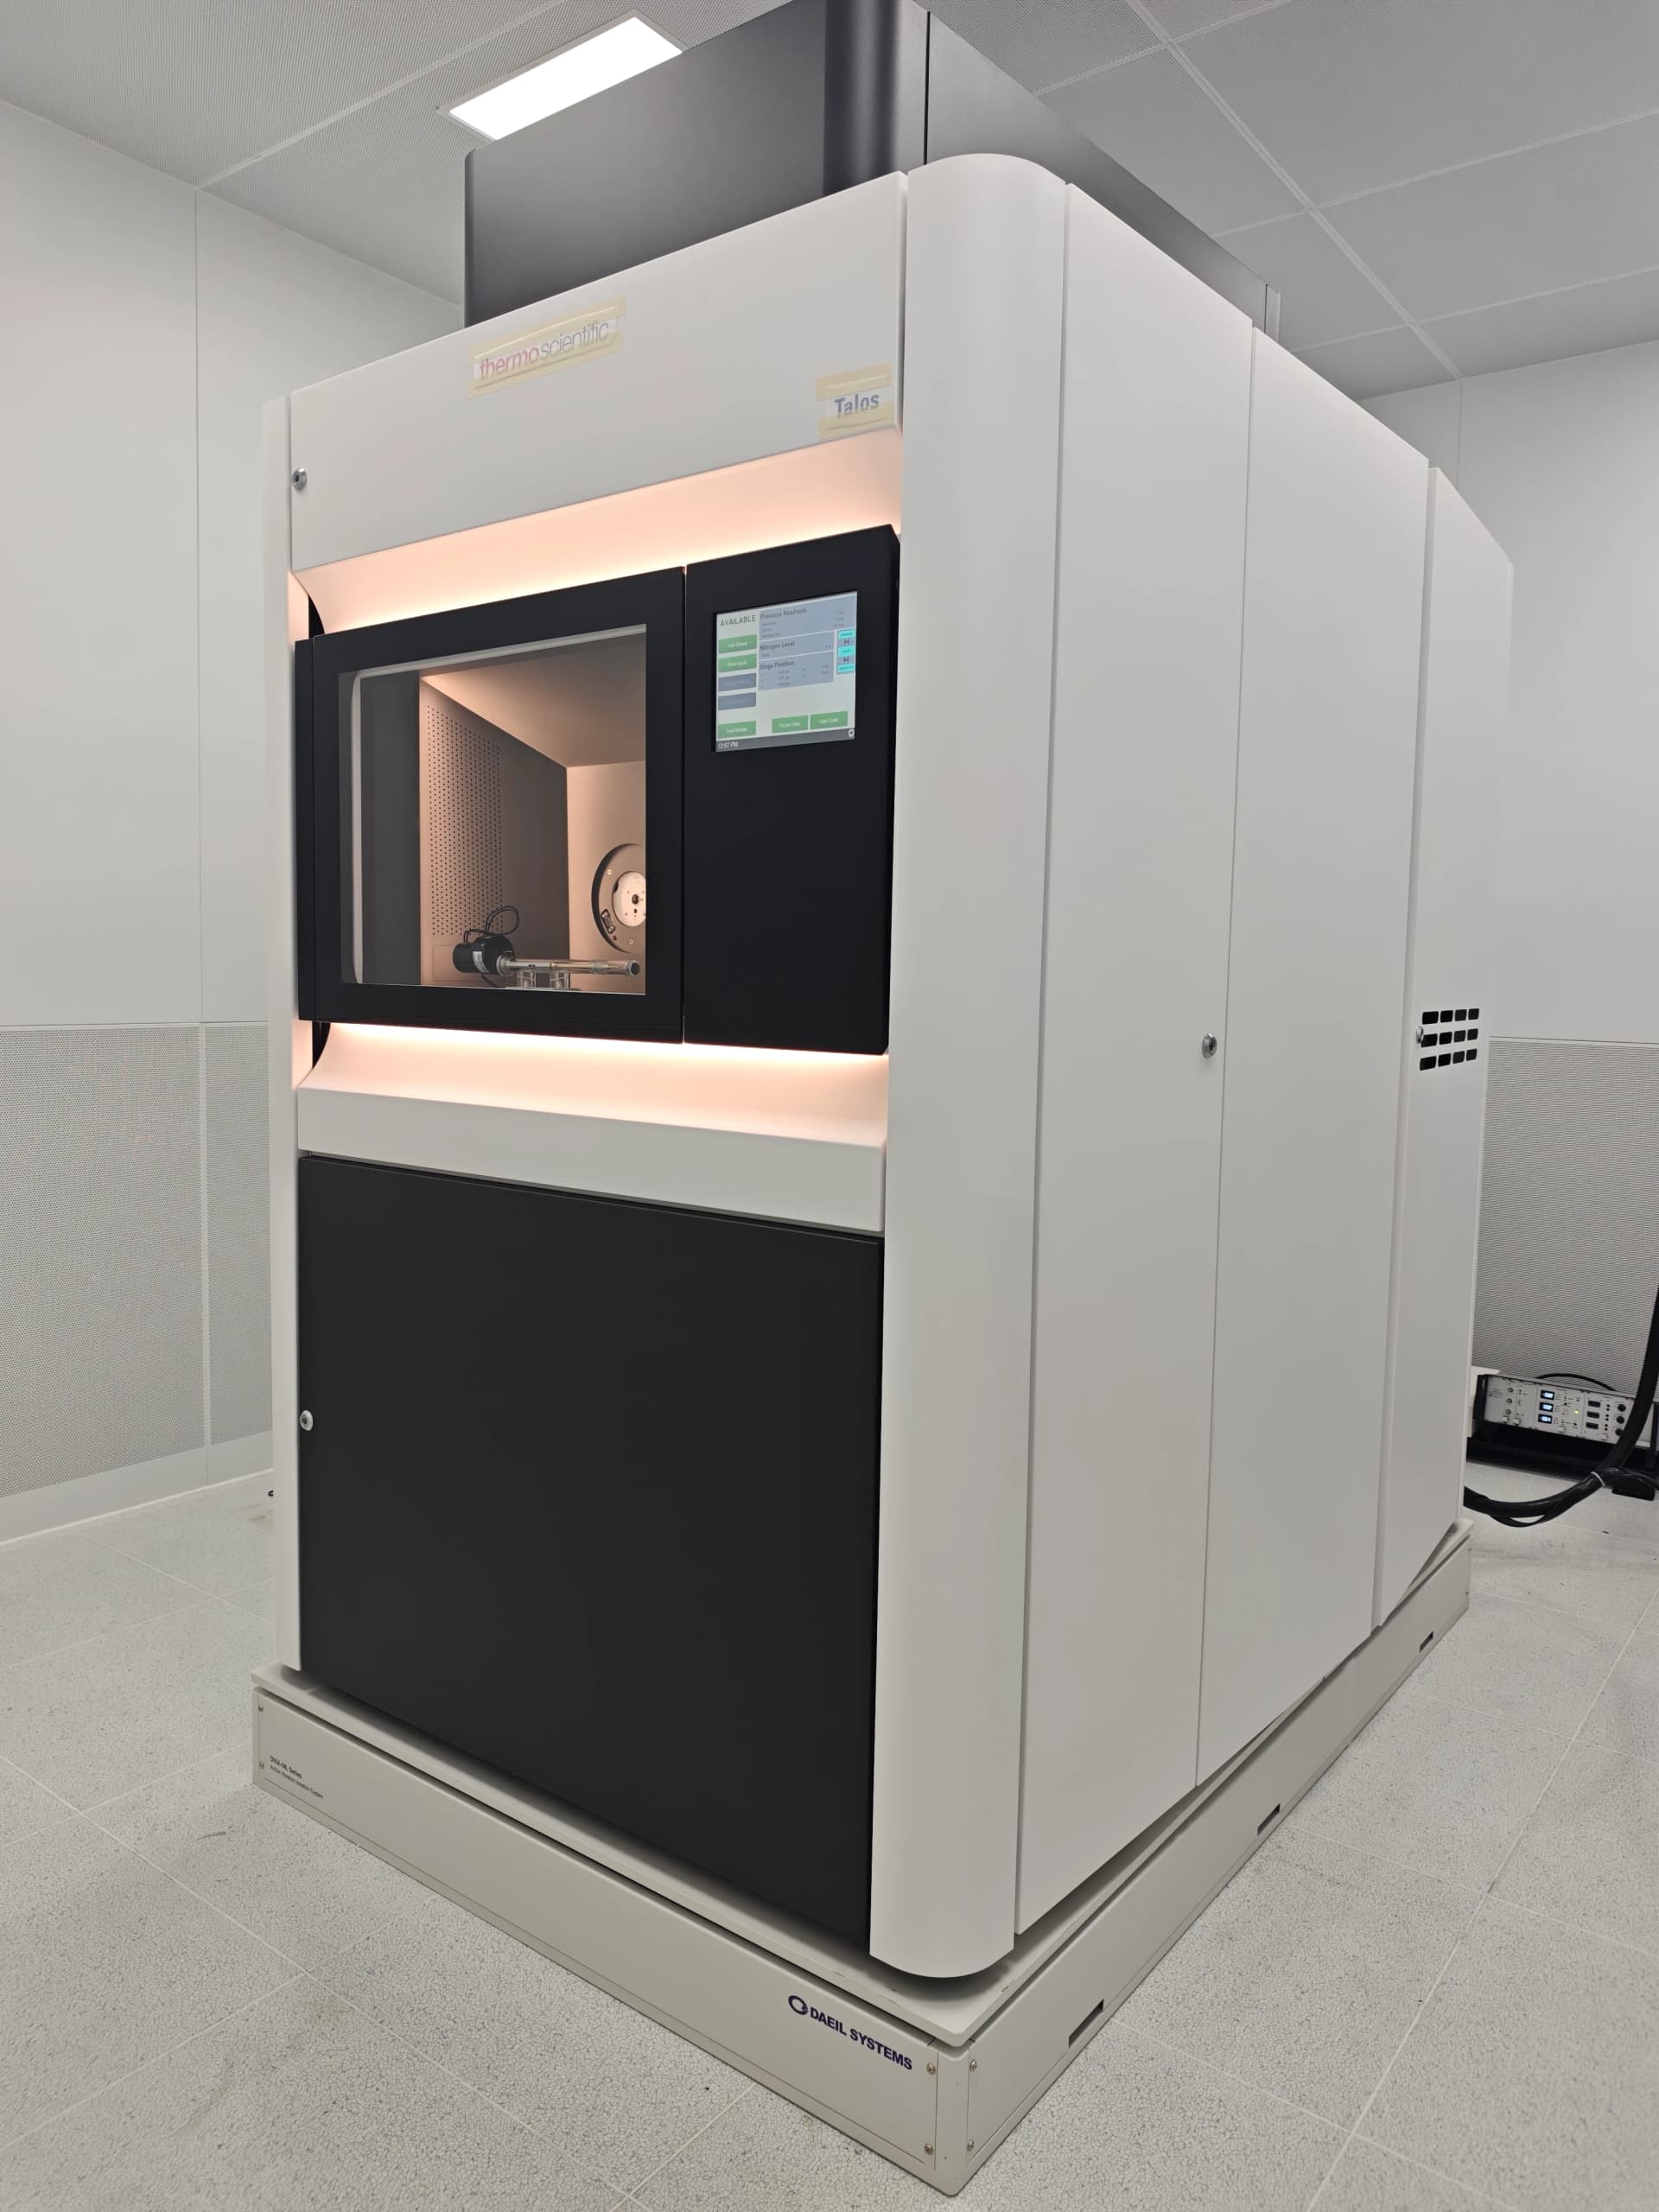
CEPREI Thermo Fisher Scientific (S)TEM Talos F200X DVIA-ML3000 (260424R5) Installation Report
DVIA-ML3000 (S/N 260424R5) installation report for a Thermo Fisher Scientific (S)TEM Talos F200X at CEPREI(电子五所) in Guangzhou(广州). Tuning (1st trial) was performed on 2026.08.25, and vibration was measured with the equipment in the IDLE state. Against the vibration specification of 1.5625 µm/s RMS [VC-F] horizontal and 3.125 µm/s RMS [VC-E] vertical (1-100 Hz), the floor failed in the Vertical and Left to Right axes and passed in Front to Back, while the isolator passed in all three axes.
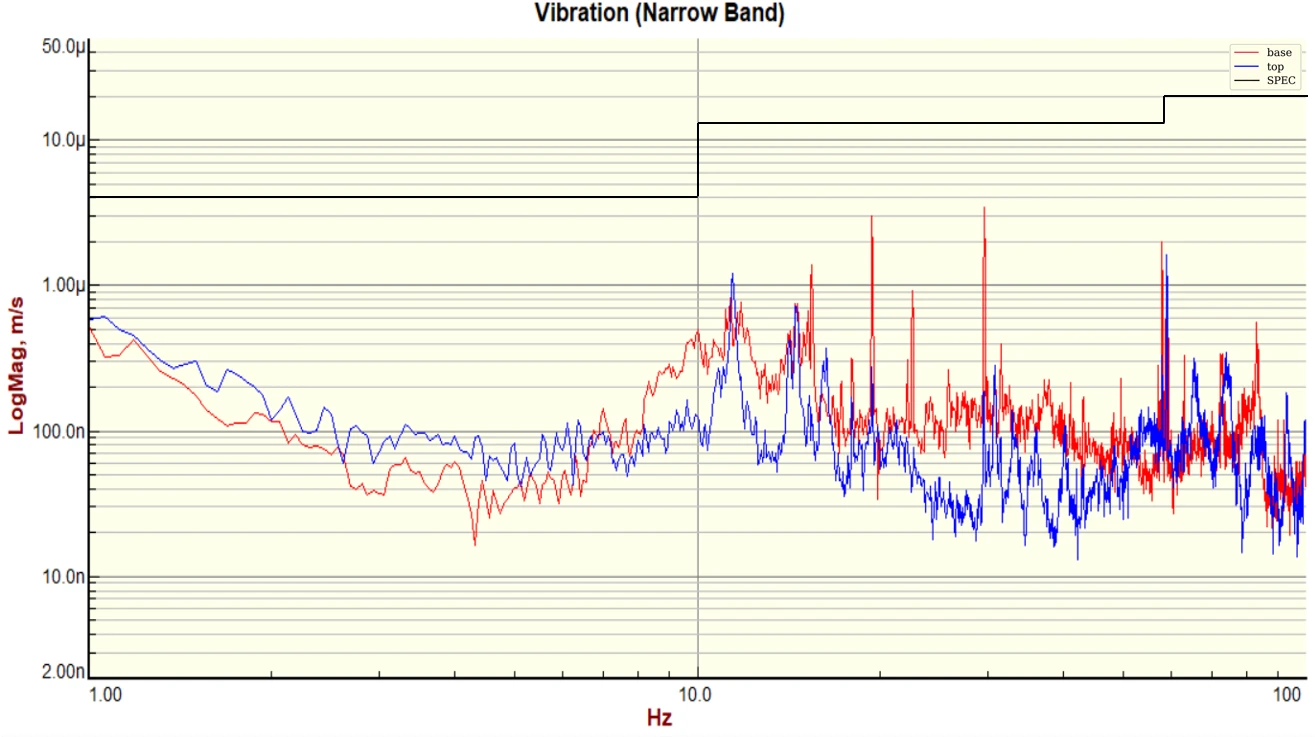
ZEISS Gemini SEM 560 FE-SEM DVIA-ML1000 Installation Report
DVIA-ML1000 installation report (serial 260316R3) for a ZEISS Gemini SEM 560 FE-SEM at the Korea Water Resources Corporation cleanroom. The 2nd active tuning was performed on 2026.08.24 with the equipment in IDLE state; floor and isolation system measurements met the ZEISS FE-SEM vibration specification.
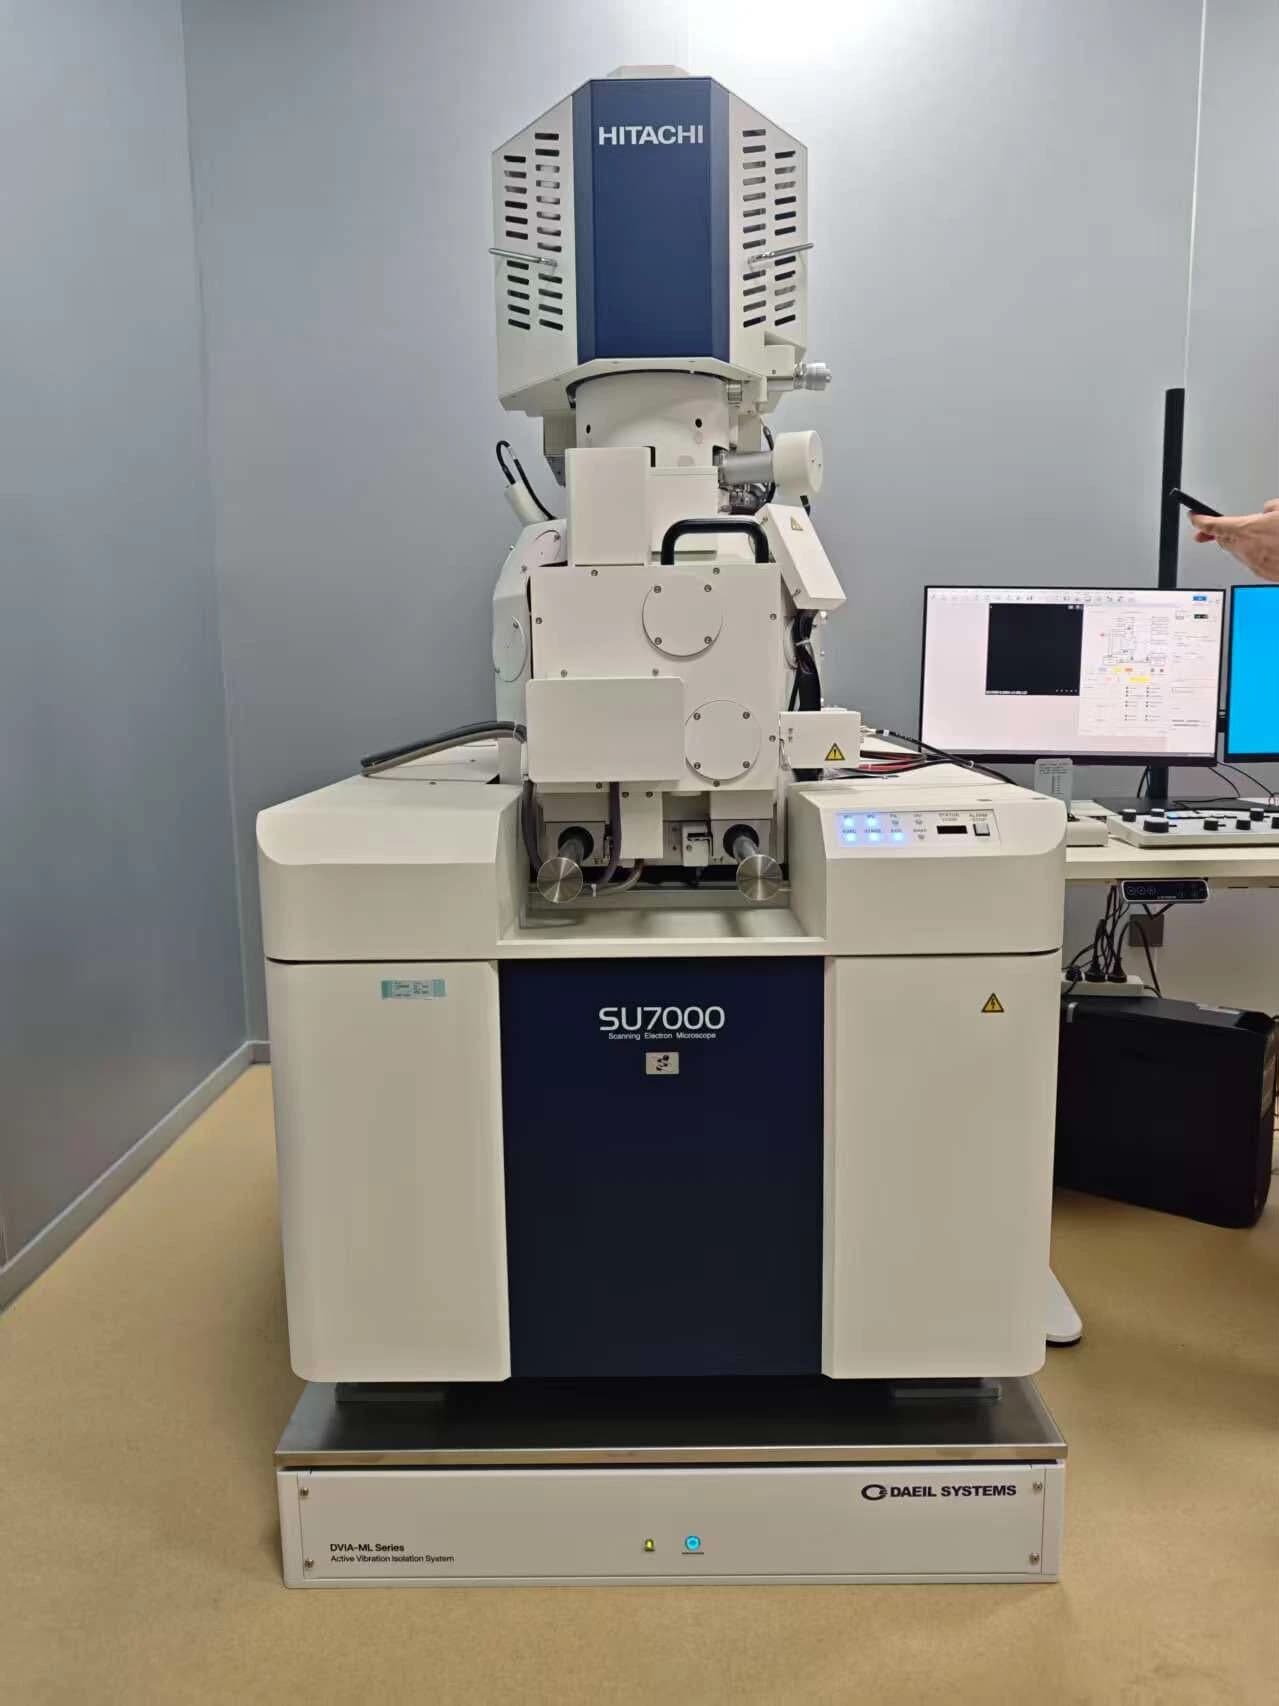
Fujian University of Technology Hitachi SU7000 SEM DVIA-ML1000 Installation Report
Hitachi High-Tech SU7000 SEM DVIA-ML1000 installation report — the DVIA-ML1000 active vibration isolation platform was installed at Fuzhou for end user Fujian University of Technology, then tuned and measured with the equipment in the IDLE state. Against the SU7000 horizontal and vertical allowable vibration specification (µm pk-pk, 1–10 Hz), the floor and the DVIA-ML1000 platform both passed on the vertical, left-to-right, and front-to-back axes. The tuning request work order, the allowable vibration tables, the per-axis Autospectrum plots and the installation photo are published.
Thermo Fisher Quattro ESEM DVIA-ML1000 Installation Report
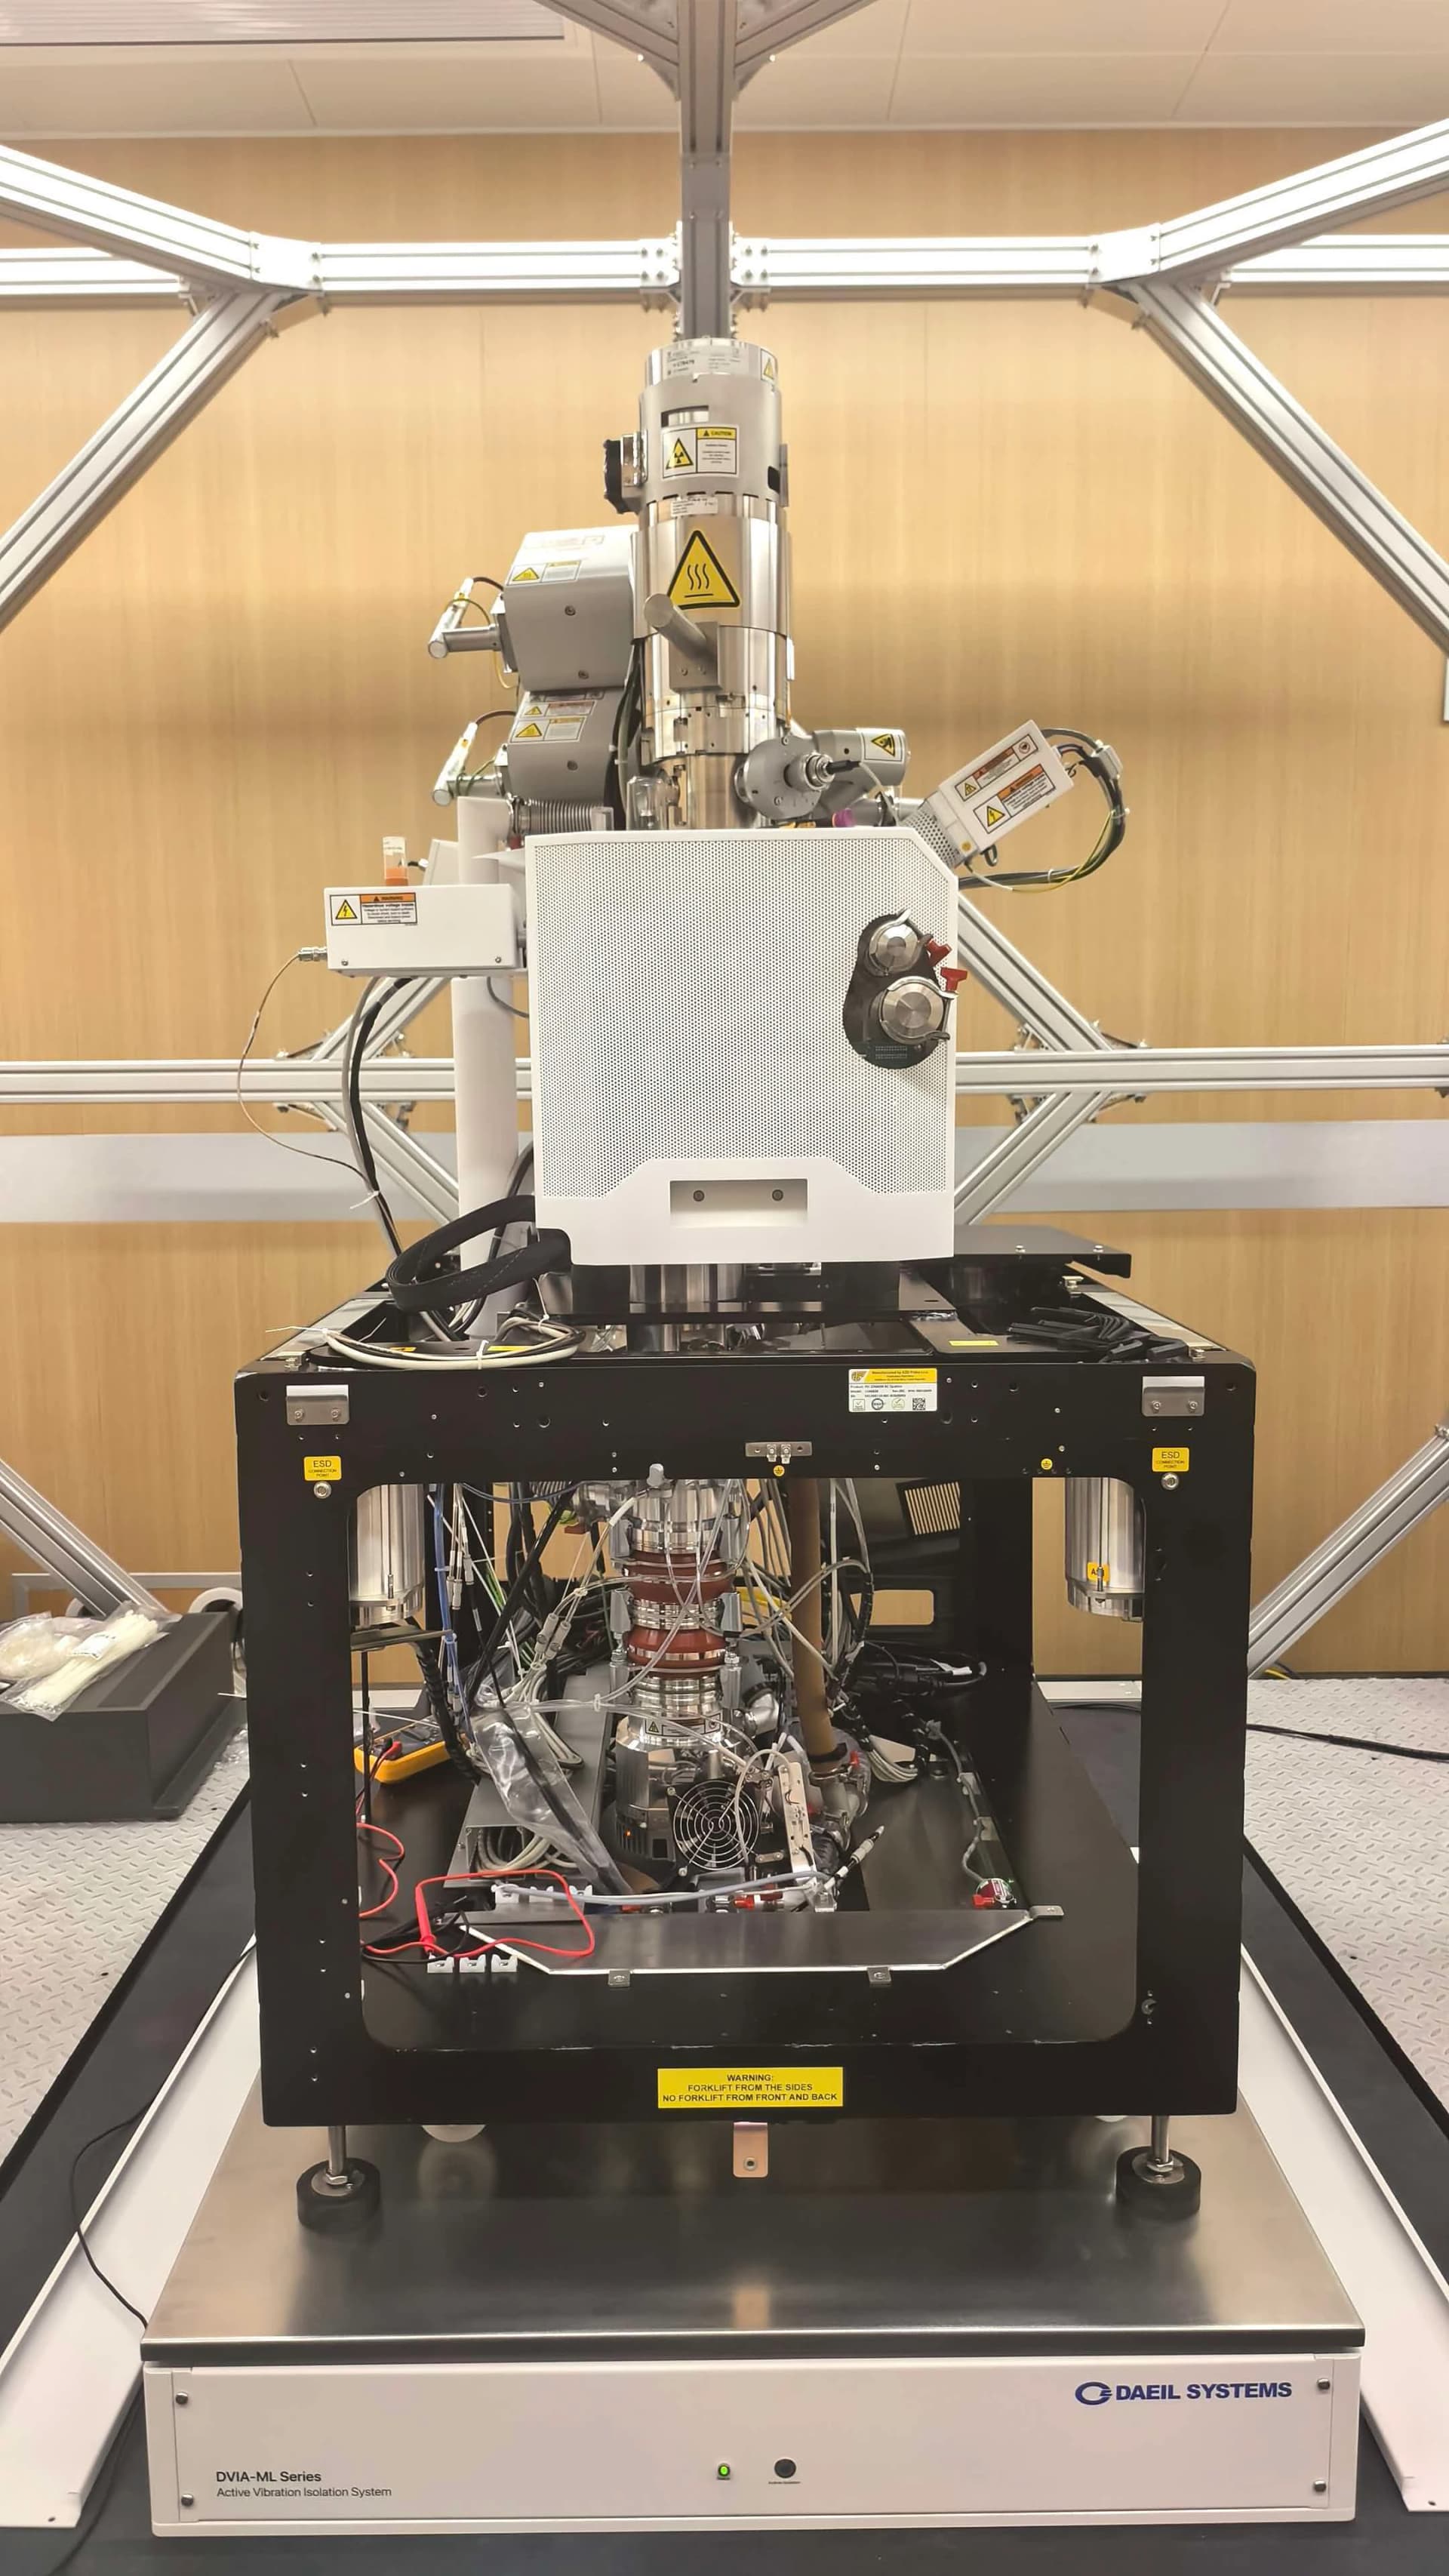
DVIA-ML1000 installation report (serial 260610R5) for a Thermo Fisher Scientific Quattro ESEM delivered through to End User Suzhou National Laboratory in Suzhou, China. Tuning was carried out on 2026.08.19 and vibration was measured with the equipment in the Turned off state, against a horizontal criterion of VC-G and a vertical criterion of VC-F. In the published VC Curve plots the floor (base) trace rises above the SPEC line on all three axes, while the trace measured on top of the DVIA-ML1000 stays below it across the whole 1–100 Hz band, showing that the platform brings the ambient environment of the laboratory down to the required VC class. Published figures: the tuning request work order, the per-axis VC Curve plots captured from the UI program, and the installation photo of the Quattro ESEM on the DVIA-ML1000.
Broadcast and Television Metrology Thermo Fisher Talos FIB-SEM DVIA-ML1000 Installation Report
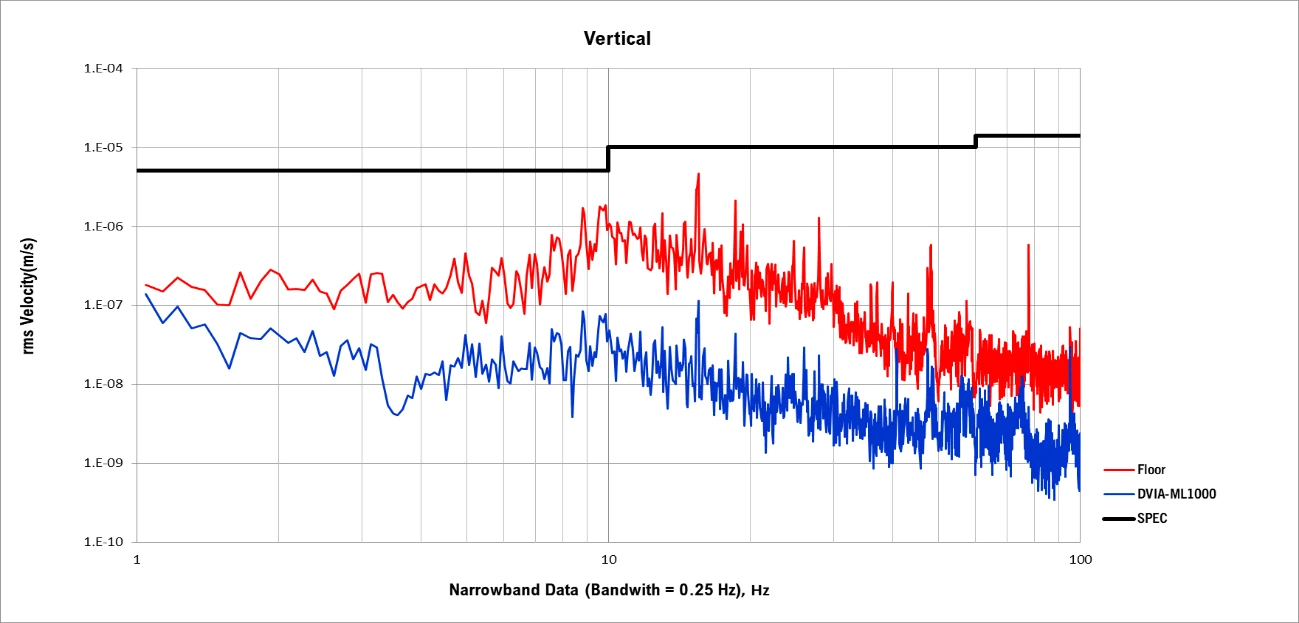
Thermo Fisher Scientific Talos FIB-SEM at Broadcast and Television Metrology in Wuxi, China, delivered through channel — DVIA-ML1000 installation report for the 1st tuning trial, tuned on June 5, 2026 with the equipment turned on/IDLE. Vertically the floor measured 4.62 µm/s RMS at 15.5 Hz while the DVIA-ML1000 platform stayed at 0.11 µm/s; left to right it went from 0.71 to 0.14 µm/s at 4.5 Hz and front to back from 0.58 to 0.034 µm/s at 3.5 Hz, so every axis passed on both the floor and the platform. Because Thermo Fisher Scientific issues site-specific ambient vibration requirements from its own SE-Tools site survey, the applicable specification follows that survey report. The tuning request work order and the per-axis VC Curves, Autospectrum and Transmissibility plots from the UI program are published.