FST LAZIN LODAS-B18 Photomask Blank Inspection System DVIF-FB (241001R5) Installation Report — Post-Reinforcement Performance Verification
Contents
Overview
Vibration measurement was performed to verify performance after reinforcement work on the DVIF-FB-1000x2000x3000H in the 3rd floor Clean Room of the FST Osan plant.
Vibration measurement was performed in the IDLE state.
The data is presented in VC Curve format, together with reference material on the corresponding vibration levels.
Vibration Isolation System Information
Model: DVIF-FB-1000x2000x3000H
Serial Number: 241001R5
Engineer
Gyumin Park · DAEIL SYSTEMS
Tuning Date
2026.08.13
Installation Site
3rd Floor Cleanroom, FST Osan Plant
End User
FST
Equipment
Manufacturer: LAZIN
Equipment: Photomask Blank Inspection System
Model: LODAS-B18
Vibration Specification
Horizontal
| Frequency [Hz] | Specification [µm/s RMS] |
|---|---|
| 1 | 25 |
| 100 | 25 |
Vertical
| Frequency [Hz] | Specification [µm/s RMS] |
|---|---|
| 1 | 25 |
| 100 | 25 |
Equipment Condition
IDLE
Measurement Equipment
10.1) Measurement Equipment
Hardware: B&K Front End Type 3040-A-040
Software: B&K Pulse Labshop22 Version
10.2) Accelerometer
PCB 393B05
Measurement Setup
F Span: 200 Hz
Lines: 2400
Engineering Units: m/s
Window: Hanning
Averaging: FFT Spectrum Averaging
Conclusion
On 13 August, in the presence of the customer's representative, vibration measurement was performed after the DVIF-FB top plate reinforcement and finishing work had been completed in the 3rd floor cleanroom of the FST Osan plant.
1. Comparison before and after reinforcement
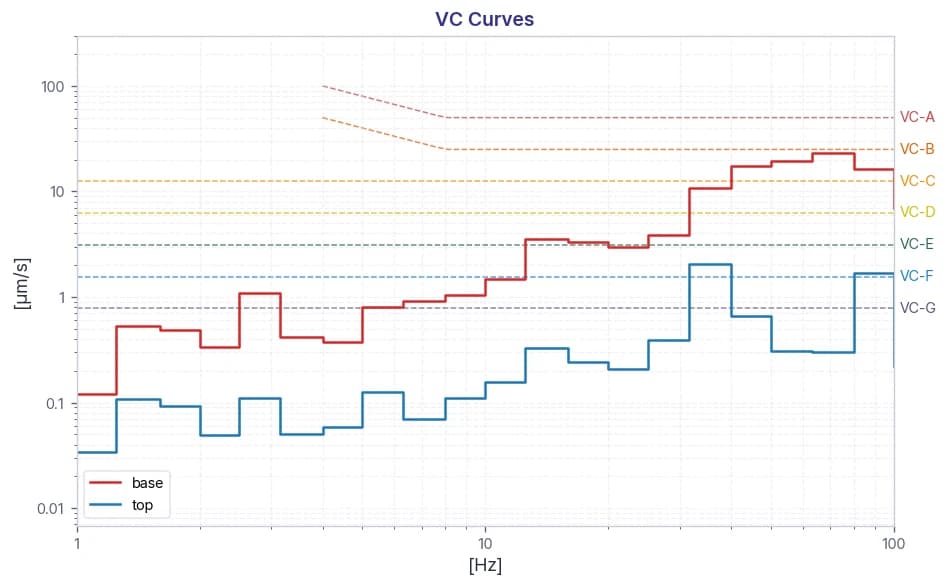
Before the structural reinforcement all three axes (vertical, left to right, front to back) exceeded SPEC (VC-B), the vibration control criterion; after the reinforcement work, results fully satisfying SPEC were secured on two axes, vertical (Z) and left to right (X).
Vertical (Z-axis): 27.7 µm/s → 17.9 µm/s (35.4% reduction) / [VC-B satisfied]
Left to Right (X-axis): 70.7 µm/s → 22.4 µm/s (68.3% reduction) / [VC-B satisfied]
Front to Back (Y-axis): 71.0 µm/s → 48.0 µm/s (32.4% reduction) / [VC-A]
A meaningful vibration reduction effect was confirmed in all directions, and in particular the front to back (Y) direction was reduced by about 32.4%.
2. Technical assessment of the front to back (Y) measurement result
The object is an upright structure more than 3 m high, and it is a structural characteristic that response amplification caused by the moment arm occurs at the upper part under horizontal excitation.
The measurement results also confirm that no amplification relative to the floor is observed in the vertical direction, whereas amplification appears only in the horizontal direction.
This reinforcement reduced such horizontal response by about 32.4% on a front to back basis, which corresponds to the practical level of improvement attainable for a structure of this shape.
The front to back direction reached the VC-A level and did not reach SPEC (VC-B).
Measurement Summary
DVIF-FB Top Plate
| Measurement Point | Vibration Specification | Axis | DVIF-FB Top Plate |
|---|---|---|---|
| 1. DVIF-FB Top Plate | See Section 8 | Vertical (Z-axis) | ✓ PASS |
| Left to Right (X-axis) | ✓ PASS | ||
| Front to Back (Y-axis) | ✗ FAIL |
Stage
| Measurement Point | Vibration Specification | Axis | Upper Equipment Stage |
|---|---|---|---|
| 1. Upper Equipment Stage | See Section 8 | Vertical (Z-axis) | ✗ FAIL |
| Left to Right (X-axis) | ✗ FAIL | ||
| Front to Back (Y-axis) | ✓ PASS |
Data and Image
DVIF-FB Top Plate — Z-axis VC Curves
DVIF-FB Top Plate — Z-axis VC Curves (Before Reinforcement)
DVIF-FB Top Plate — X-axis VC Curves
DVIF-FB Top Plate — X-axis VC Curves (Before Reinforcement)
DVIF-FB Top Plate — Y-axis VC Curves
DVIF-FB Top Plate — Y-axis VC Curves (Before Reinforcement)
Upper Equipment Stage — Z-axis VC Curves
Upper Equipment Stage — X-axis VC Curves
Upper Equipment Stage — Y-axis VC Curves
Reference
The table below classifies vibration levels based on IEST-RP-CC012.2.
Notes:
1. As measured in one-third octave bands of frequency over the frequency range 8 to 80 Hz (VC-A and VC-B) or 1 to 80 Hz (VC-C through VC-G).
2. The detail size refers to the line width in the case of microelectronics fabrication, the particle (cell) size in the case of medical and pharmaceutical research, etc. It is also applicable to imaging associated with probe technologies, AFM and nanotechnology.
3. The information provided in this table is for reference only. In most instances it is advisable to seek the advice of a specialist who is familiar with the application and the vibration requirements of the equipment and the process.
Share this Case Study
Case Study Information
Related Case Studies
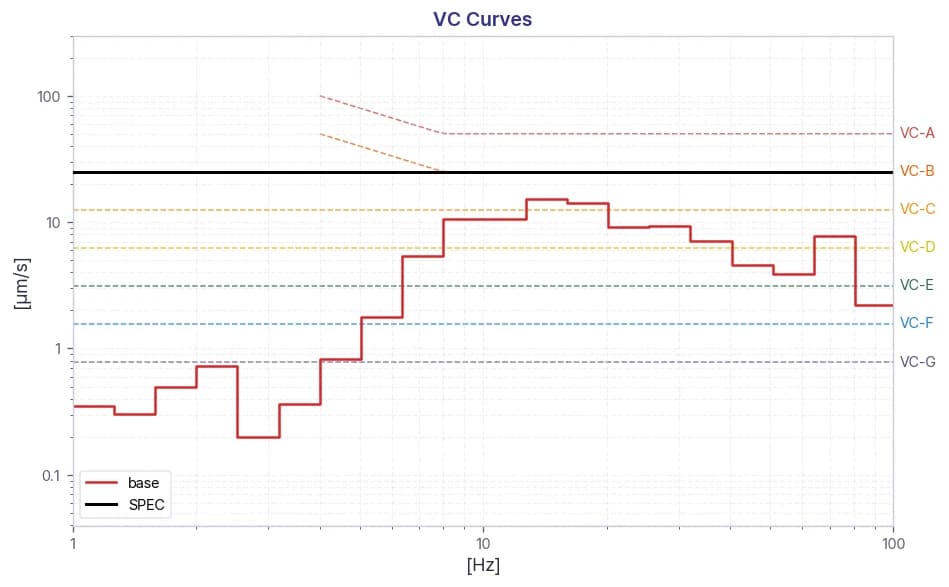
FST LAZIN LODAS-B18 Photomask Blank Inspection System DVIF-FB (241001R5) Installation Report — September 2026 Re-Measurement and Upper Equipment Lower Frame Baseline
Quantum Photonics Research Laboratory attocube attoDRY1000/SU Cryostat DVIA-ML1000 Installation Report