Tier-1 Semiconductor Icheon OLYMPUS Microscope MX63L DVIA-T78 (260819S1) Installation Report
Contents
Author
Gyumin Park · DAEIL SYSTEMS
Installation Date
2026.09.01
Report Written Date
2026.09.03
Overview
Tuning and vibration measurement were carried out after the DVIA-T78 was installed in the 1F laboratory of the P&T4 building at the Tier-1 Semiconductor Icheon campus.
Inspection and vibration measurement were carried out with the unit in the IDLE state.
The data are presented as VC Curves, together with reference material on vibration levels.
Vibration Isolation Platform
Model: DVIA-T78
Serial number: 260819S1
Engineer
Taeheon Kim, Gyumin Park, Youngwook Kim · DAEIL SYSTEMS
Tuning Date
2026.09.01
Installation Site
Tier-1 Semiconductor Icheon campus, P&T4 building, 1F laboratory
End User
Tier-1 Semiconductor
Customer Equipment
Manufacturer: OLYMPUS
Equipment: Microscope
Model: MX63L
Vibration Specification
-
Equipment Status
IDLE
Vibration Measuring Equipment
10.1) Measurement Equipment
Hardware: B&K Front End Type 3040-A-040
Software: B&K Pulse Labshop22 Version
10.2) Accelerometer
PCB 393B05
Vibration Measurement Setup
F Span: 200 Hz
Lines: 2400
Engineering Units: m/s
Window: Hanning
Averaging: FFT Spectrum Averaging
Conclusion
This vibration measurement and demo test were carried out to determine how vibration coming from other equipment in the 1F laboratory of the P&T4 building at the Icheon campus affects the OLYMPUS microscope (MX63L), and to verify the vibration attenuation obtained when our active vibration isolation platform (DVIA-T) is applied.
Existing environment: There is no clearly defined allowable vibration specification for the equipment mounted on top. However, during equipment operation the microscope image resolution degraded and shaking (noise) appeared, and the improvement in the operating environment provided by the passive isolation table currently in use was confirmed to be insufficient.
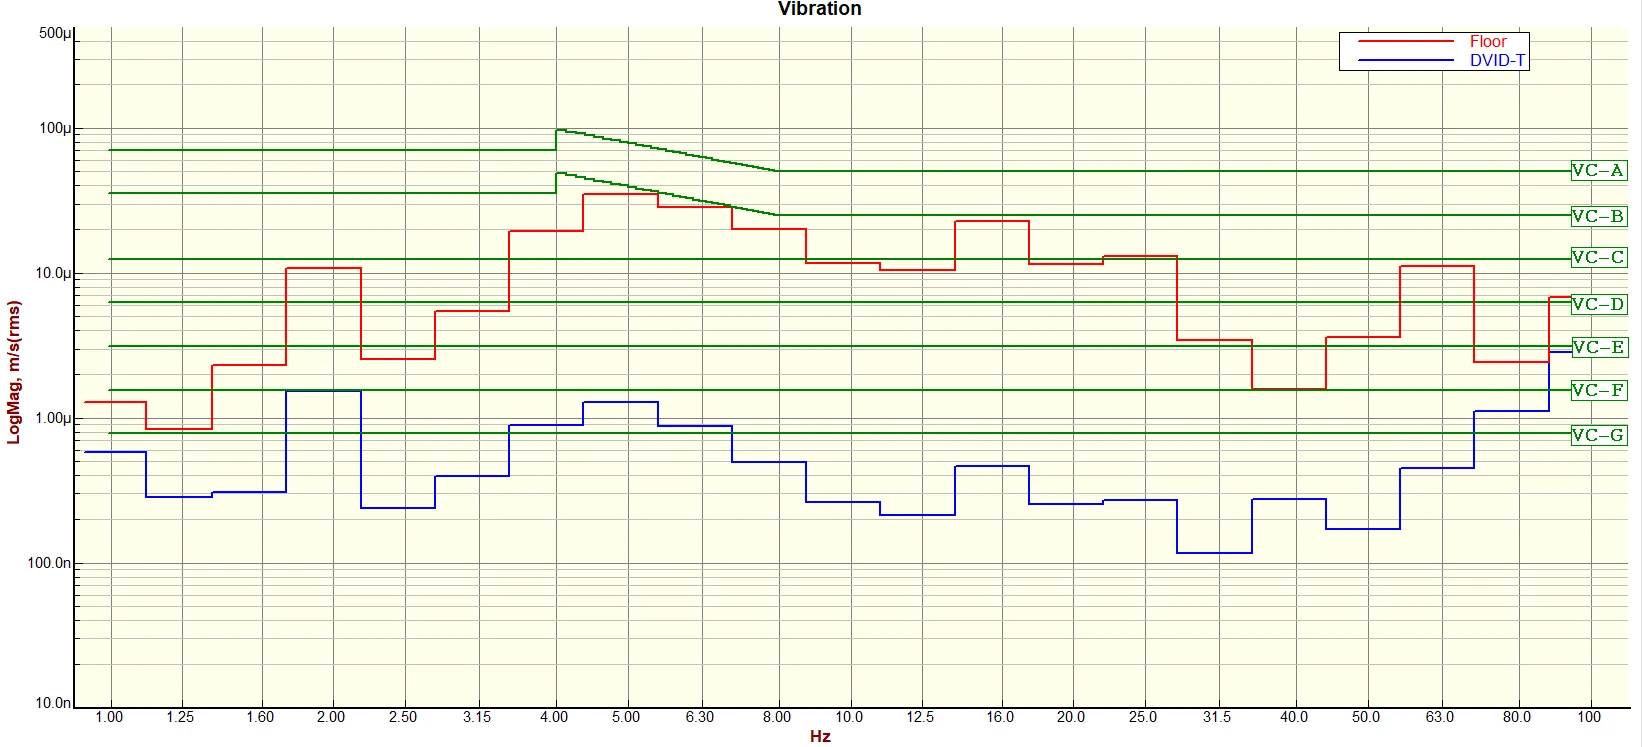
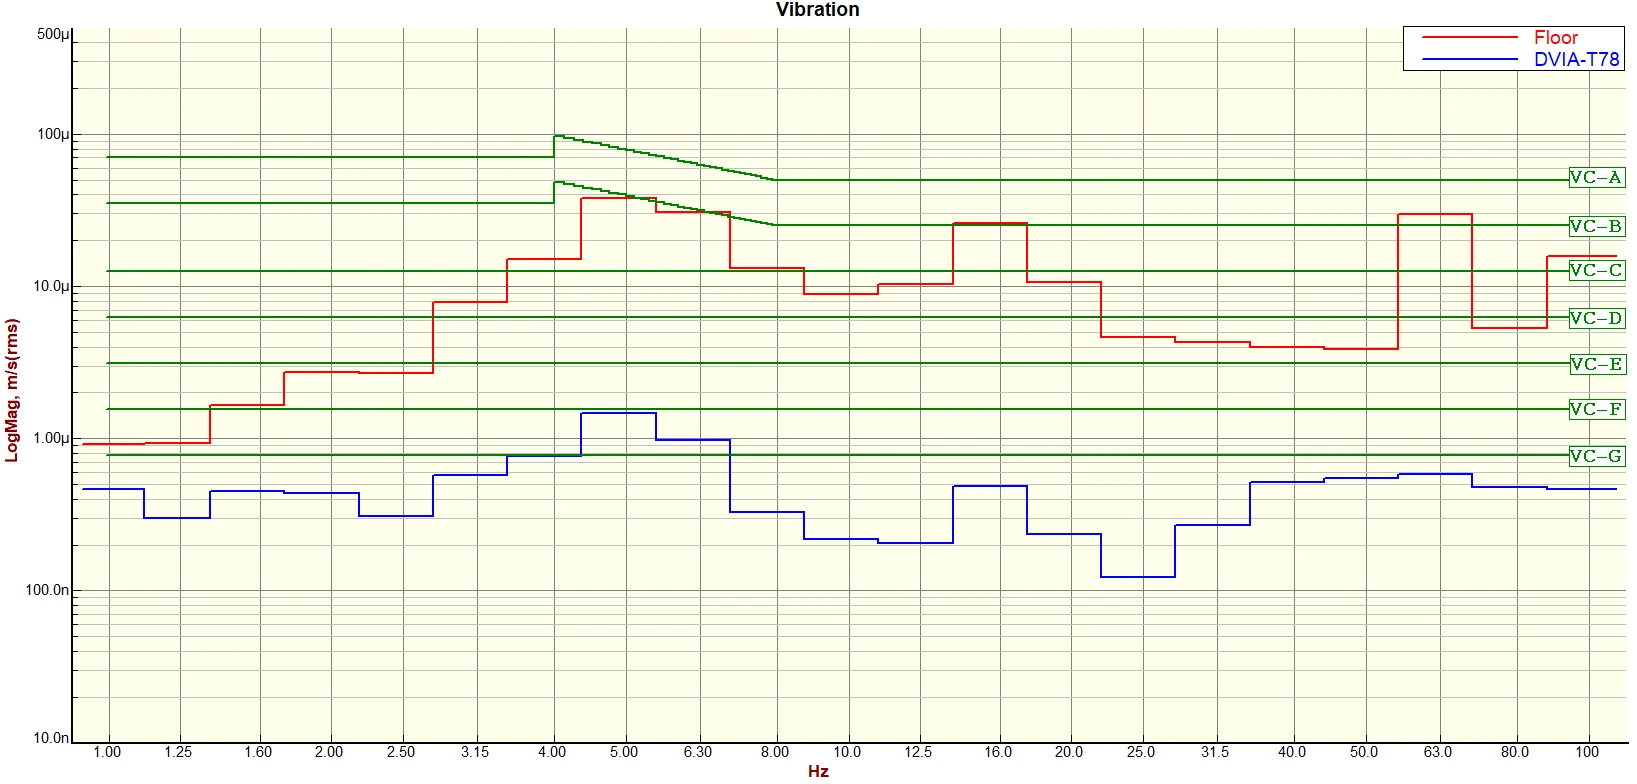
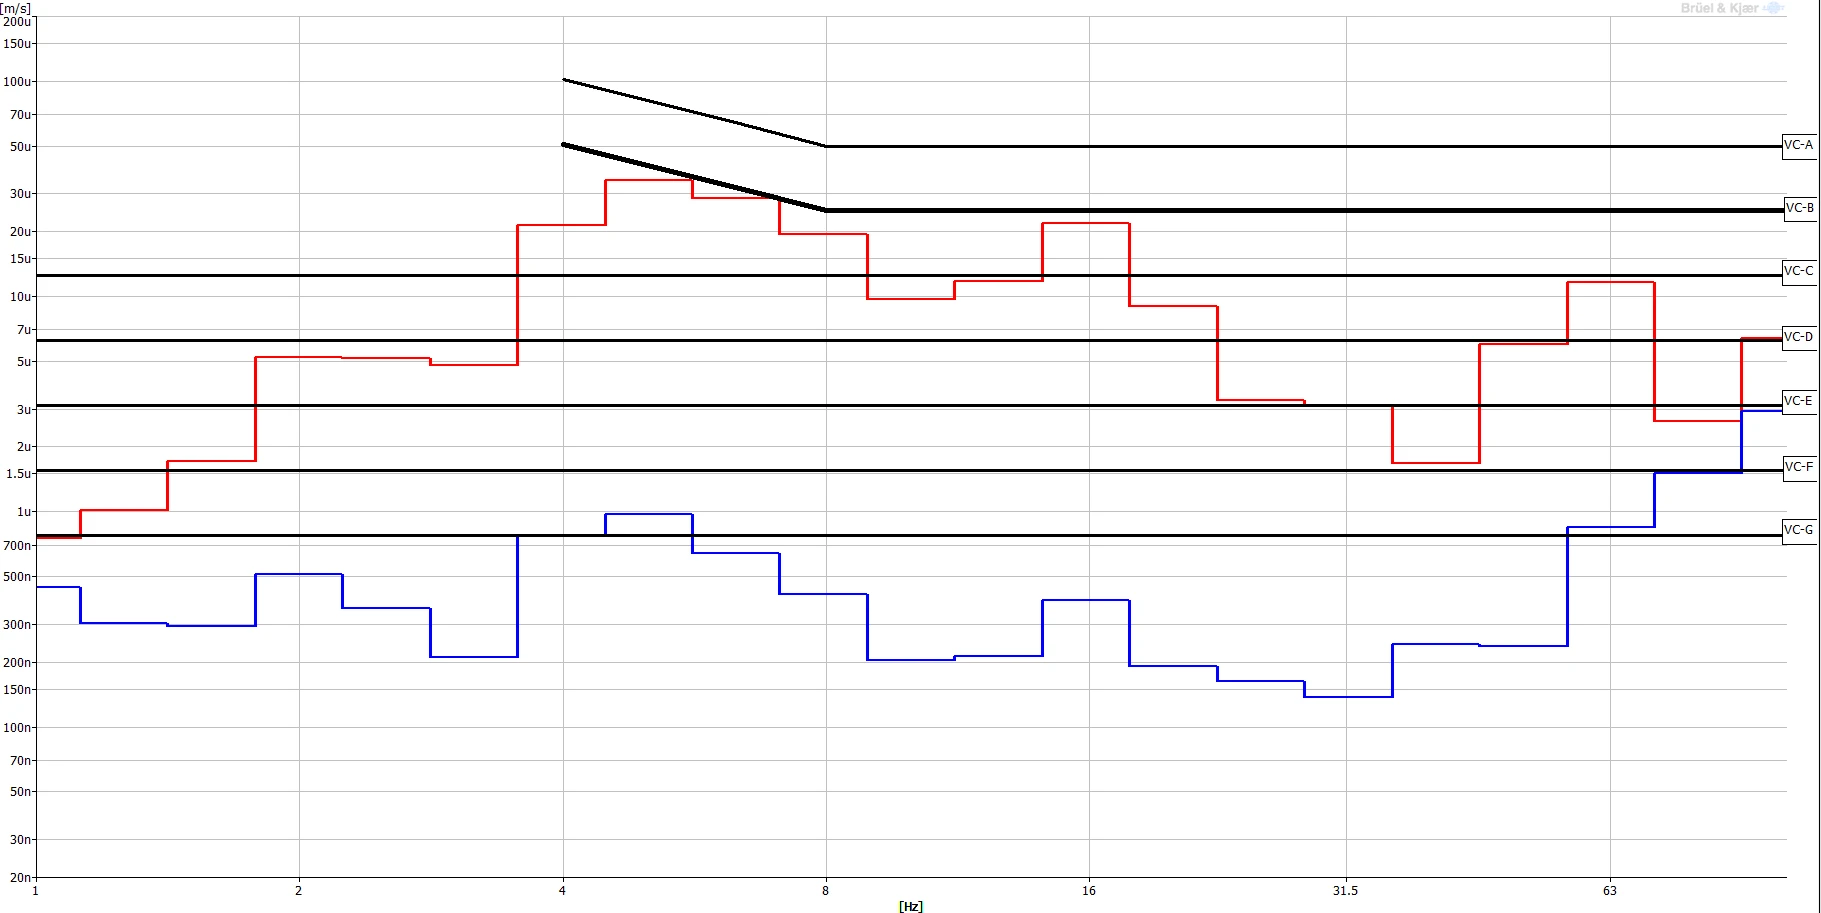
Improvement after applying the DVIA-T (active vibration isolation platform): After running the demo test with our DVIA-T active vibration isolation platform, vibration was stabilised to the VC-D ~ VC-E level in all three axes (X, Y, Z). In particular, when the actual microscope image was checked after the DVIA-T was applied, the image shaking and noise that had previously occurred disappeared completely, confirming that a sharp and stable resolution was secured.
Measurement Summary
Demo Test 1 (Desk / DVIA-T)
| Measurement Point | Vibration Specification | Axis | Measurement Result | |
|---|---|---|---|---|
| Floor | DVIA-T | |||
| 1. Desk 2. DVIA-T | - | Vertical (Z-axis) | Operating Theatre (ISO) | VC-E |
| Left to Right (X-axis) | Residential Area (ISO) | VC-E | ||
| Front to Back (Y-axis) | VC-A | VC-D | ||
Demo Test2 (Desk / DVIA-T)
| Measurement Point | Vibration Specification | Axis | Measurement Result | |
|---|---|---|---|---|
| Floor | DVIA-T | |||
| 1. Desk 2. DVIA-T | - | Vertical (Z-axis) | Residential Area (ISO) | VC-D |
| Left to Right (X-axis) | VC-A | VC-E | ||
| Front to Back (Y-axis) | Residential Area (ISO) | VC-E | ||
Vibration Measurement 1 (Floor / Passive isolation table top)
| Measurement Point | Vibration Specification | Axis | Measurement Result | |
|---|---|---|---|---|
| Floor | DVIA-T | |||
| 1. Floor 2. ✓ Passive isolation table top | - | Vertical (Z-axis) | VC-C | Residential Area (ISO) |
| Left to Right (X-axis) | VC-A | VC-A | ||
| Front to Back (Y-axis) | Operating Theatre (ISO) | Residential Area (ISO) | ||
Vibration Measurement 2 (Desk / Passive isolation table top)
| Measurement Point | Vibration Specification | Axis | Measurement Result | |
|---|---|---|---|---|
| Floor | DVIA-T | |||
| 1. Desk 2. ✓ Passive isolation table top | - | Vertical (Z-axis) | Operating Theatre (ISO) | VC-A |
| Left to Right (X-axis) | VC-A | VC-A | ||
| Front to Back (Y-axis) | Operating Theatre (ISO) | VC-A | ||
Measurement Data
Demo Test 1
Demo Test 1 — Z-axis Autospectrum
Demo Test 1 — Z-axis VC Curves
Demo Test 1 — X-axis Autospectrum
Demo Test 1 — X-axis VC Curves
Demo Test 1 — Y-axis Autospectrum
Demo Test 1 — Y-axis VC Curves
Demo Test2
Demo Test2 — Z-axis Autospectrum
Demo Test2 — Z-axis VC Curves
Demo Test2 — X-axis Autospectrum
Demo Test2 — X-axis VC Curves
Demo Test2 — Y-axis Autospectrum
Demo Test2 — Y-axis VC Curves
Vibration Measurement 1
Vibration Measurement 1 — Z-axis Autospectrum
Vibration Measurement 1 — Z-axis VC Curves
Vibration Measurement 1 — X-axis Autospectrum
Vibration Measurement 1 — X-axis VC Curves
Vibration Measurement 1 — Y-axis Autospectrum
Vibration Measurement 1 — Y-axis VC Curves
Vibration Measurement 2
Vibration Measurement 2 — Z-axis Autospectrum
Vibration Measurement 2 — Z-axis VC Curves
Vibration Measurement 2 — X-axis Autospectrum
Vibration Measurement 2 — X-axis VC Curves
Vibration Measurement 2 — Y-axis Autospectrum
Vibration Measurement 2 — Y-axis VC Curves
Reference
The table below classifies vibration levels according to IEST-RP-CC012.2.
Notes:
1. Measured in one-third octave bands of frequency over the frequency range 8-80 Hz (VC-A and VC-B) or 1-80 Hz (VC-C through VC-G).
2. Detail size refers to the line widths for microelectronics fabrication, the particle (cell) size for medical and pharmaceutical research, etc. It is not relevant to imaging associated with probe technologies, AFMs, and nanotechnology.
3. The information given in this table is for reference. In most cases it is advisable to seek the advice of a specialist familiar with the application and the vibration requirements of the equipment and the process.