WONIK IPS DVIA-T78 (211213R1) Installation Report
Contents
Engineer
Engineer: Donggyu Park
Tuning Date
December 12, 2025
Report Written Date
December 16, 2025
Overview
Tuning and vibration measurement were performed on the T78 installed in the 4F wafer analysis lab at the WONIK IPS Jinwi site.
A re-visit and re-tuning were performed due to high vibration measured against the Bruker equipment's own test criteria on the isolator.
Tuning and vibration measurement were conducted with the equipment installed and in a Turned on/IDLE state.
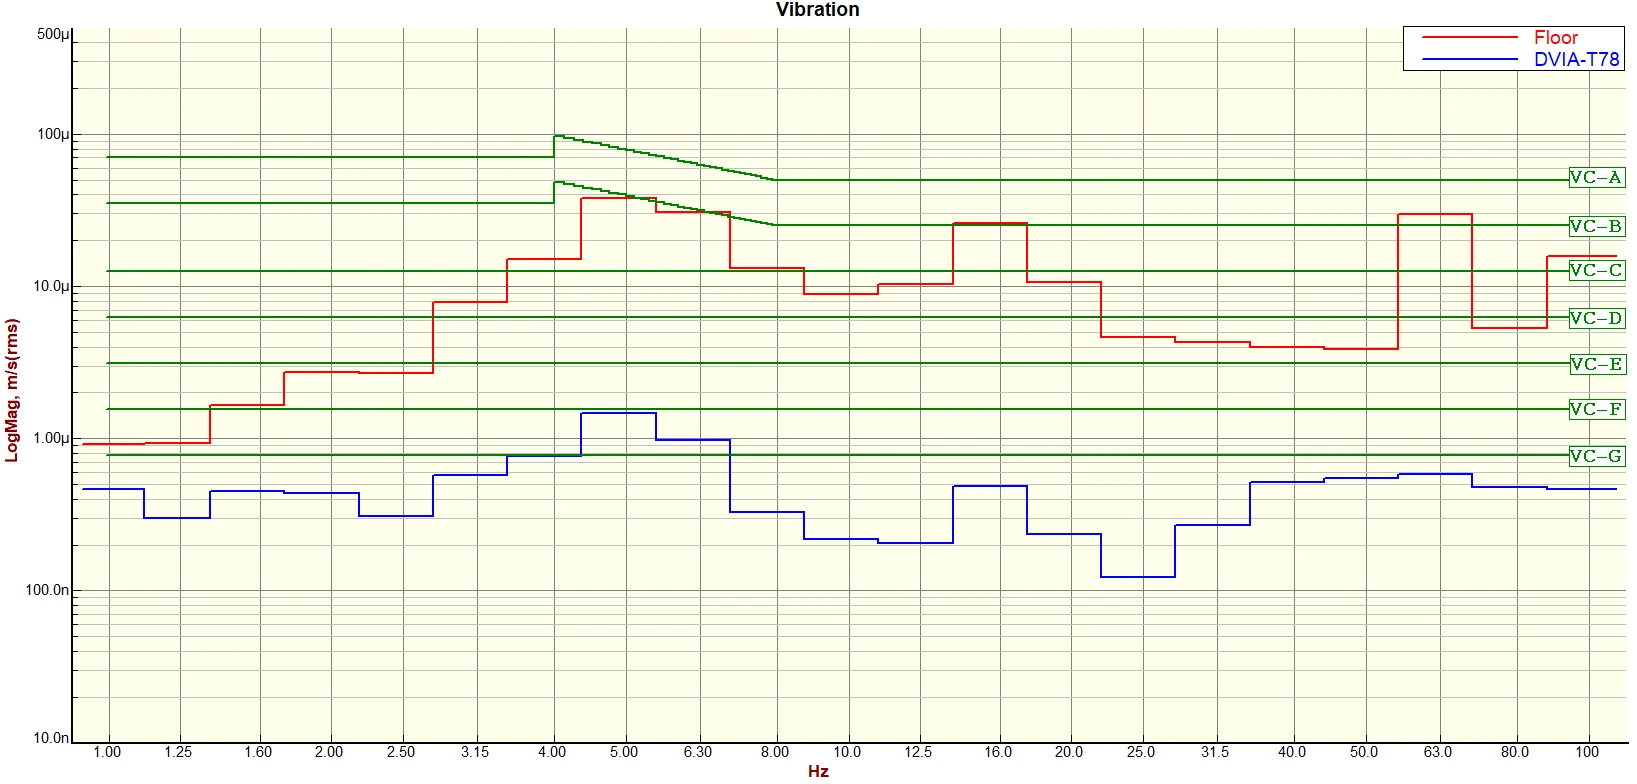
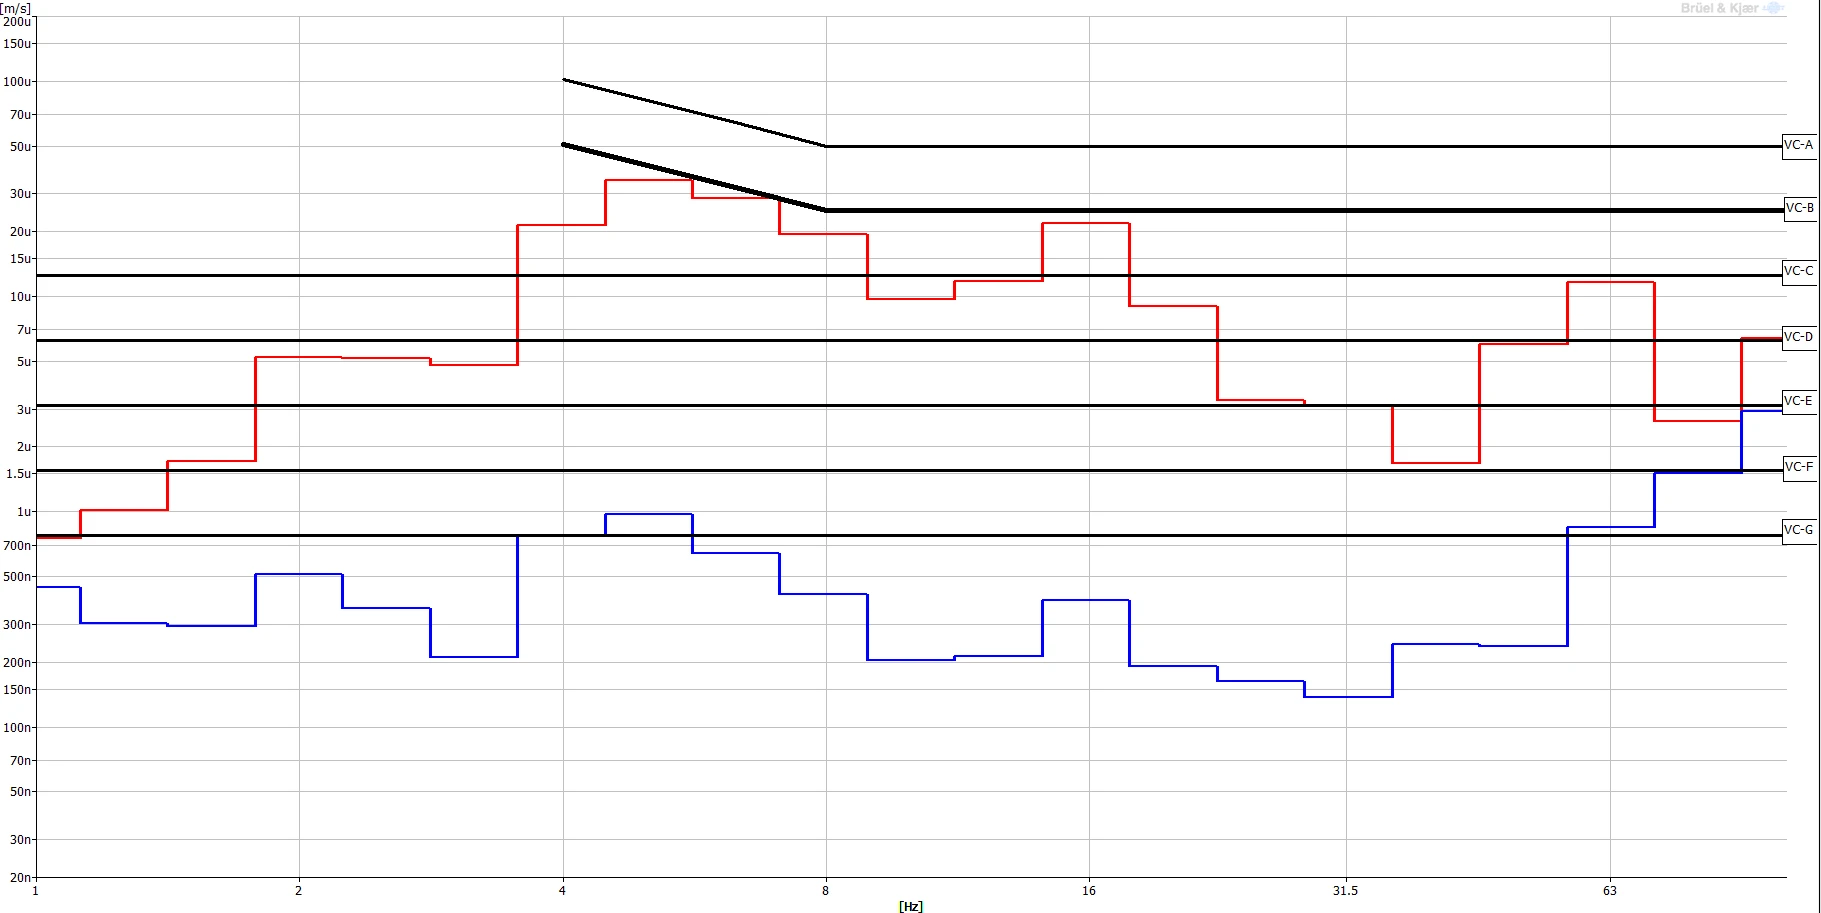
Data are presented as VC curves, and Reference materials are provided for the vibration levels.
Vibration Isolation Platform
Model: DVIA-T78
Serial number: 211213R1
Field Engineer
Park Dong-gyu, DAEIL SYSTEMS Development Team
Installation Site
WONIK IPS Jinwi site, 4F wafer analysis lab
End User
WONIK IPS
Customer Equipment
Manufacturer: BRUKER
Equipment: Nano Indentation tester
Model: TS77
Equipment Specification
-
Equipment Status
Equipment installed and Turned on/IDLE
Measuring Equipment
1) Data Physics DAQ
-Hardware: QUATTRO, Serial Number: 22436
-Software: SignalCalc ACE
2) Accelerometer
PCB Accelerometer
Model: 393B05
Vibration Measurement Setup
F Span: 200
Lines: 3200
Engineering Units: m/s
Window: Hanning
Averaging: FFT Spectrum Averaging
Average Mode: Exponential, 40
Conclusion
Together with Bruker and WONIK IPS personnel, we confirmed that the DVIA-T78 delivered good isolation performance in all directions.
Bruker stated that their own test was unsatisfactory because rubber pillars directly below the equipment reduce vibration from the equipment before it reaches the isolator, making isolation difficult.
Bruker agreed with headquarters to proceed with modifying the equipment.
Measurement Data
| Place of Measurement | Status | Direction | Floor | DVIA-T78 |
|---|---|---|---|---|
| WONIK IPS Jinwi site, 4F wafer analysis lab 1. Floor vibration 2. DVIA-T78 | Turned on/IDLE | Vertical | VC-B @ 5 Hz | VC-E @ 90 Hz |
| Left to Right | VC-E @ 2.5 Hz | VC-G @ 63 Hz | ||
| Front to Back | VC-D @ 2.5 Hz | VC-F @ 90 Hz |
Data and Image
Vertical VC Curves
Vertical Autospectrum
Vertical Transmissibility
Left to Right VC Curves
Left to Right Autospectrum
Left to Right Transmissibility
Front to Back VC Curves
Front to Back Autospectrum
Front to Back Transmissibility
Reference
Notes:
1. VC-A/B is measured in 1/3 octave bands from 8-80 Hz, VC-C through VC-G from 1-80 Hz.
2. Detail size refers to line widths in microelectronics manufacturing or particle sizes in medical research.