Hyundai Motor Keyence Laser Confocal Microscope VK-3000 DVIA-TD45 Installation Report
Contents
Overview
Inspection background: When the isolation system was active, vibration occurred in the high-magnification measurement range, while the vibration decreased when it was inactive.
Field situation and root-cause analysis: On-site equipment inspection confirmed oscillation of the vibration isolation system.
After re-tuning, the customer equipment requirements were satisfied and normal operation of the high-magnification microscope was confirmed.
The influence of airflow from the ventilation duct around the equipment was additionally checked.
The measured data are presented as VC Curves, and reference vibration-level criteria are provided.
Vibration Isolation System Information
Model: DVIA-TD45
Serial Number: 20260422R5
Engineer
Seongyun Jeong, DAEIL SYSTEMS
Tuning Date
June 8, 2026
Installation Site
Hyundai Motor Environmental Technology Research Center
End User
Hyundai Motor
Customer Equipment
Manufacturer: Keyence Korea
Equipment: Laser Confocal Microscope
Model: VK-3000
Vibration Specification
VC-C
Equipment Status
Vibration measurement was performed with the customer equipment in operation after installation. The exhaust from the ventilation duct on the left adversely affects the measurement, so relocating the ventilation duct is recommended.
Figure 1. Influence of the ventilation duct on the left side of the equipment
Measuring Equipment
Measurement Equipment
- Hardware: B&K Type 3050-A-040
- Software: PULSE 22
Accelerometer: PCB 393B05
Measuring Set-up
F Span: 200 Hz
Lines: 2400
Engineering Units: m/s
Window: Hanning
Averaging: FFT Spectrum Averaging
Measurement Summary
| Measurement Point | Status | Vibration Specification | Axis | Floor | DVIA-TD45 |
|---|---|---|---|---|---|
| 1. Floor 2. DVIA-TD45 | In operation | VC-C | Vertical | ✓ PASS | ✓ PASS |
| Left to Right | ✗ FAIL | ✓ PASS | |||
| Front to Back | ✓ PASS | ✓ PASS |
Data and Image
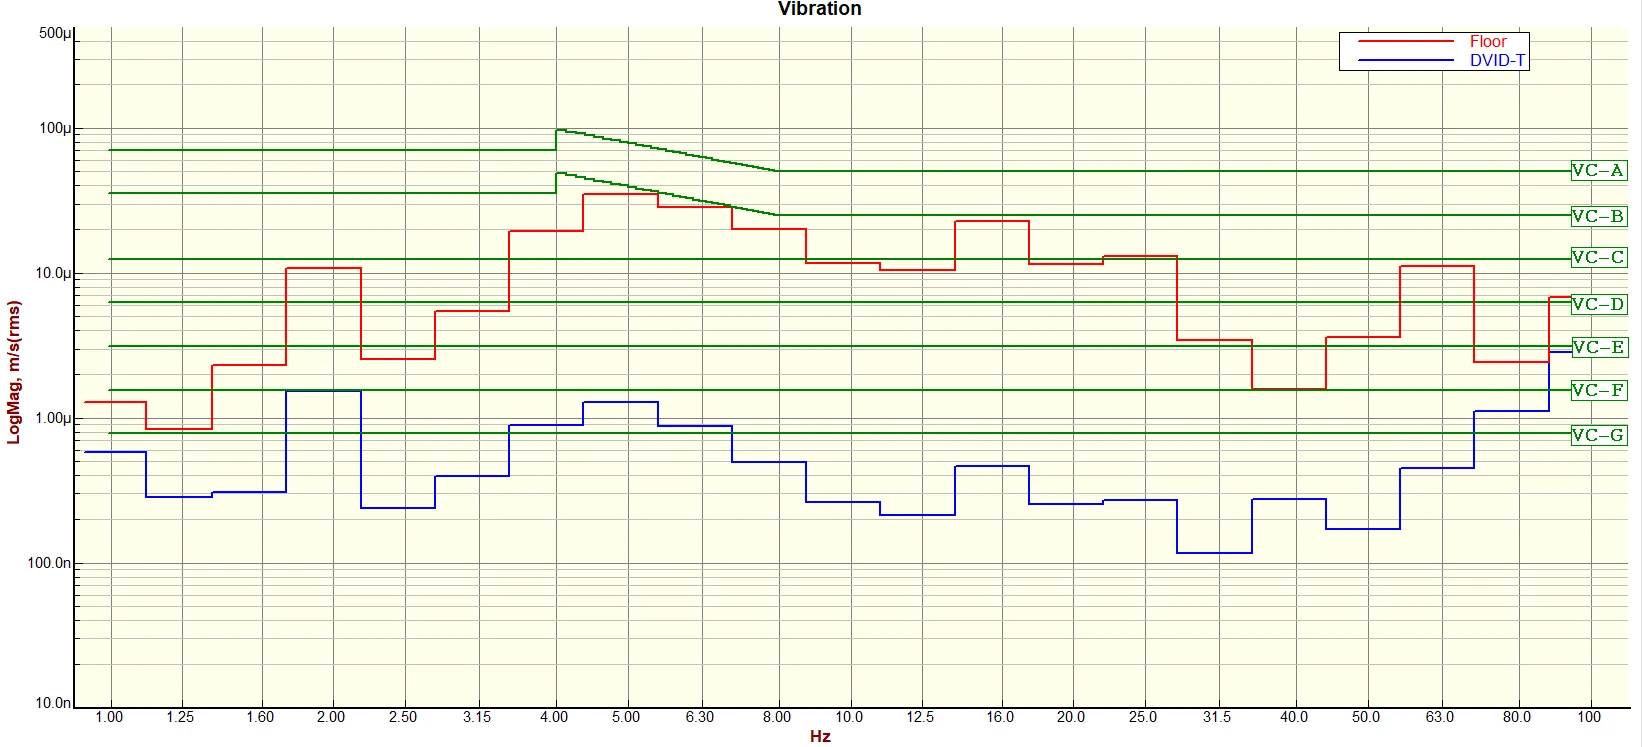
Vertical VC Curves
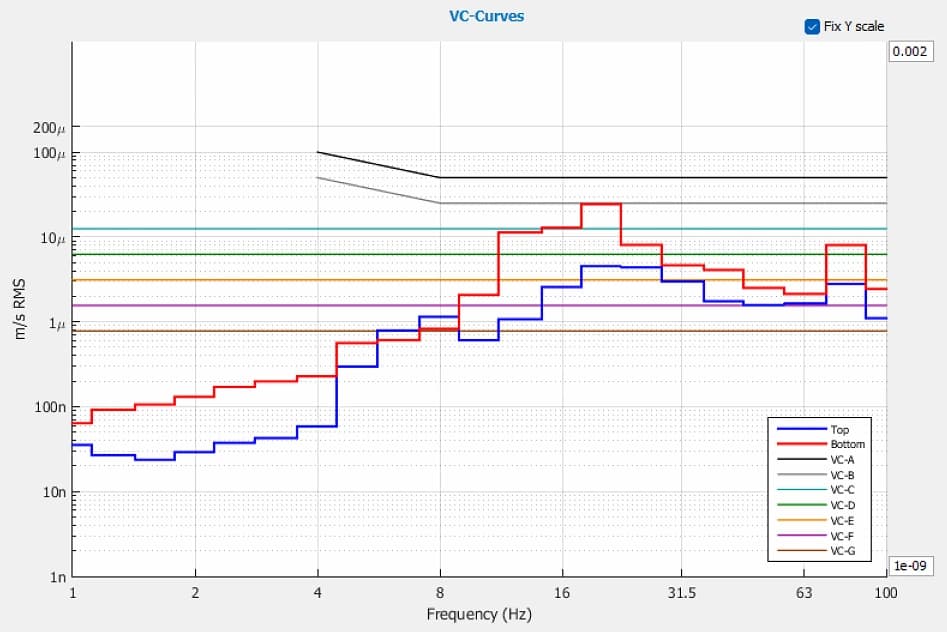
Left to Right VC Curves
Front to Back VC Curves
Reference
Notes:
1. VC-A/B is measured in 1/3 octave bands from 8-80 Hz, VC-C through VC-G from 1-80 Hz.
2. Detail size refers to line widths in microelectronics manufacturing or particle sizes in medical research.