WONIK IPS DVIA-T78 (211213R1) Installation Report
Contents
Engineer
Engineer: Chaewon Lee
Installation Date
April 29, 2026
Report Written Date
May 4, 2026
Overview
Inspection was performed on the DVIA-T78 installed in the 4F wafer analysis lab at the WONIK IPS Jinwi site.
Inspection and vibration measurements were conducted with the equipment in a Turned on/IDLE state.
Data are presented as VC curves, and Reference materials are provided for the vibration levels.
Vibration Isolation Platform
Model: DVIA-T78
Serial number: 211213R1
Field Engineer
Chaewon Lee from DAEIL SYSTEMS, field engineer
Tuning Date
April 29, 2026
Installation Site
WONIK IPS Jinwi site, 4F wafer analysis lab
End User
WONIK IPS
Customer Equipment
Manufacturer: Bruker
Equipment: Nano Indentation tester
Model: TS77
Equipment Specification
N/A
Equipment Status
Equipment installed / Turned on/IDLE
Measuring Equipment
1) Data Physics DAQ
Hardware: QUATTRO, Serial Number: 22436
Software: SignalCalc ACE
2) Accelerometer
PCB Accelerometer
Model: 393B05
Vibration Measurement Setup
F Span: 200 Hz
Lines: 3200
Engineering Units: m/s
Window: Hanning
Averaging: FFT Spectrum Averaging
Averaging mode: Exponential, 40
Conclusion
On-site inspection results showed that the DVIA-T78 isolator delivered very good overall performance. In all directions it demonstrated more than 90% isolation performance above 2 Hz, confirming that the isolator itself was operating normally.
Together with the Bruker engineer, we examined changes in floor vibration and isolator-top vibration at the moments when image noise appeared on the TS77 tool. The measurements showed that, at the times when image noise occurred, both floor vibration and DVIA-T78 top vibration increased in the 1–10 Hz band compared with steady-state conditions.
Even at those moments, the DVIA-T78 attenuated VC-B/C-class floor vibration toward VC-D/E on the top surface, which means the isolator was still performing its isolation function normally.
Therefore, the main cause of TS77 image noise is judged not to be isolator performance degradation, but an increase in building vibration that raised the isolator-top level together with the floor. In other words, although the isolator substantially attenuated floor vibration, when building vibration itself rises the top vibration can still increase relatively and affect image quality.
For stable operation and reduced image noise, we recommend relocating the equipment to a location with lower and more stable floor vibration than the current installation site.
Measurement Data
| Place of Measurement | Status | Direction | Floor | DVIA-T78 |
|---|---|---|---|---|
| WONIK IPS Jinwi site, 4F wafer analysis lab 1. Floor vibration 2. DVIA-T78 | Turned on/IDLE | Vertical | VC-A @ 63 Hz | VC-G @ 63 Hz |
| Left to Right | VC-A @ 10 Hz | VC-F @ 10 Hz | ||
| Front to Back | VC-A @ 10 Hz | VC-G @ 10 Hz |
Data and Image
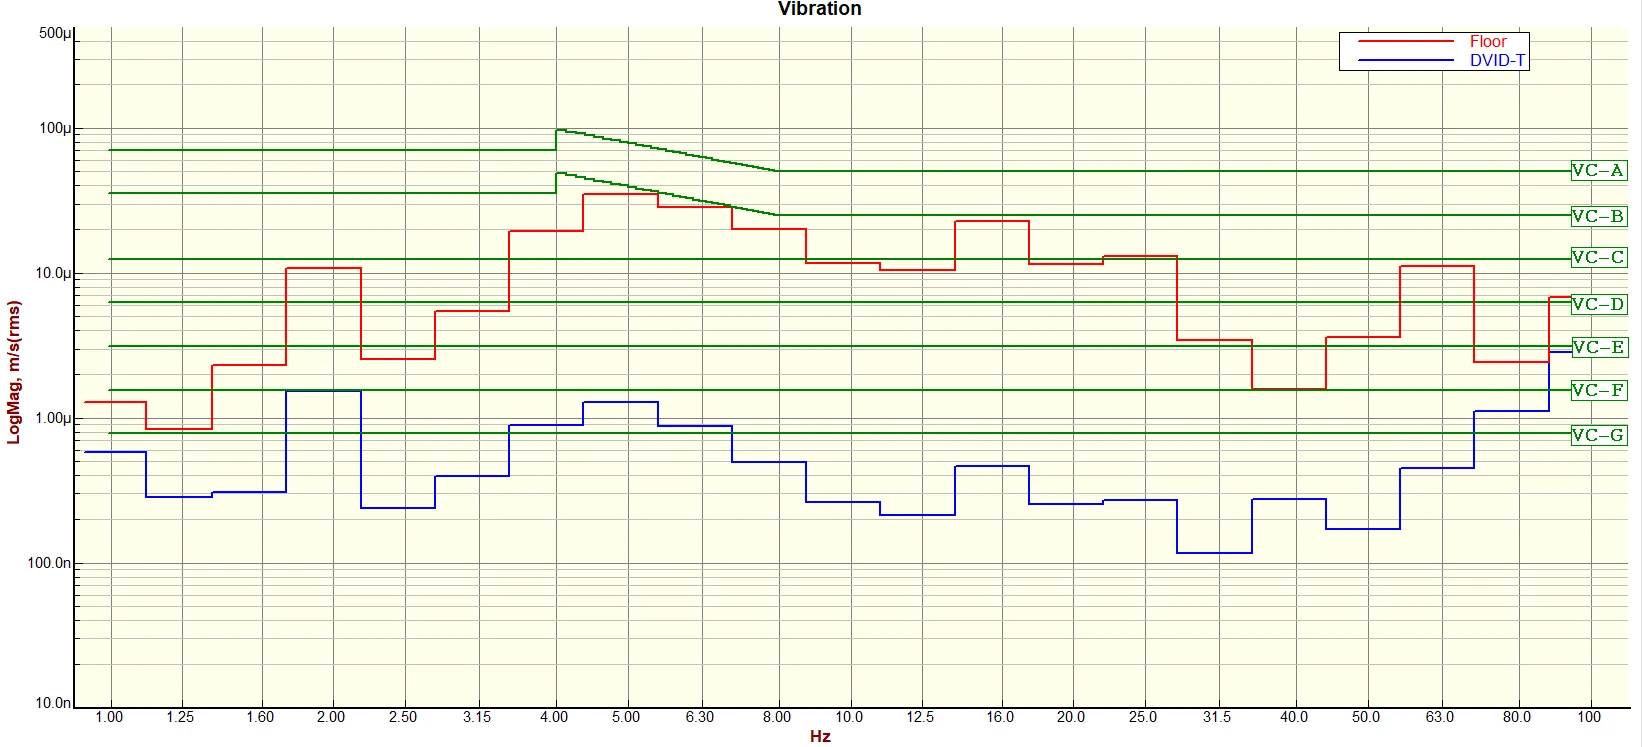
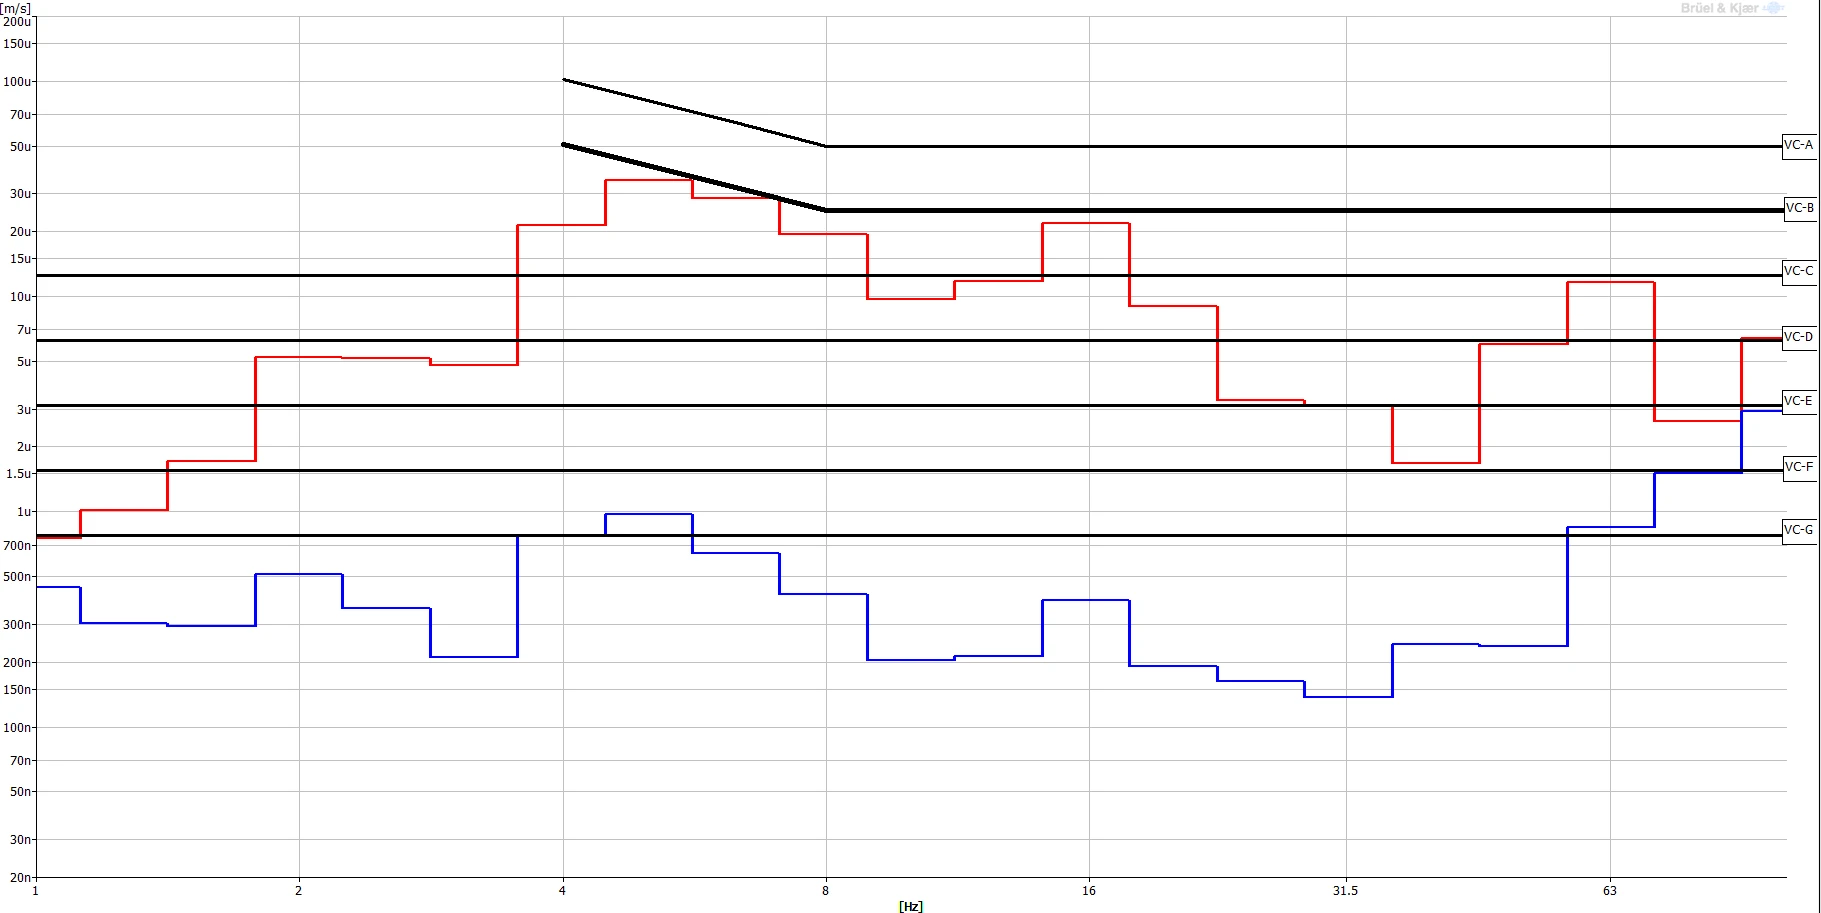
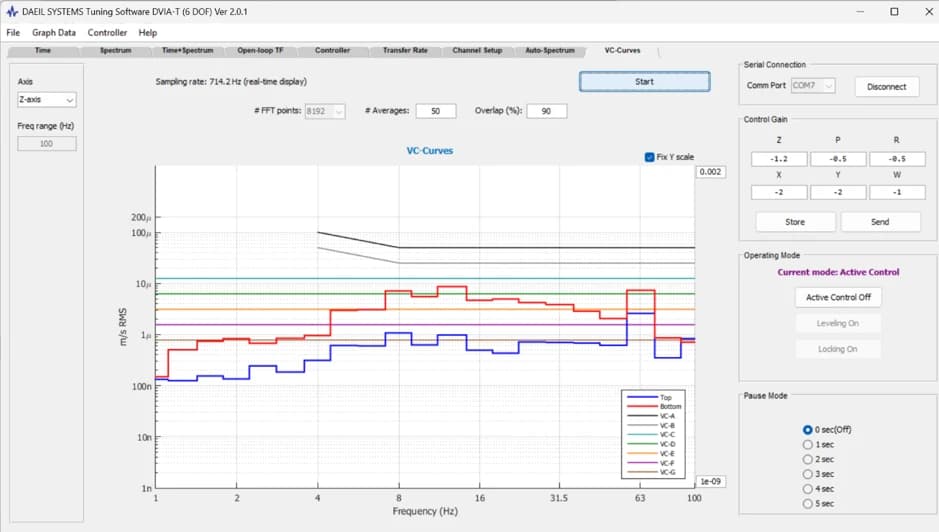
Vertical VC Curves
Vertical Autospectrum
Vertical Transmissibility
Left to Right VC Curves
Left to Right Autospectrum
Left to Right Transmissibility
Front to Back VC Curves
Front to Back Autospectrum
Front to Back Transmissibility
14-2) DVIA-T78 steady-state vs. noise-event vibration comparison Data
Steady-state vibration Data
Vibration data during noise events
Reference
Notes:
1. VC-A/B is measured in 1/3 octave bands from 8-80 Hz, VC-C through VC-G from 1-80 Hz.
2. Detail size refers to line widths in microelectronics manufacturing or particle sizes in medical research.