JEOL Korea Ltd. ETRI JEOL JBX-8100FS DVIA-P4000 Installation Report
Contents
Report Information
Report: DVIA-P4000 Installation Report, S/N 260731R1
Customer: JEOL Korea Ltd.
Author: Changhyeon Moon · DAEIL SYSTEMS
Installation date: 2026.11.09 ~ 2026.11.10
Report date: 2026.11.12
Overview
The DVIA-P4000 vibration isolation table installed for the JEOL JBX-8100FS (E-Beam Lithography) in the clean room of Lab Building 4 at the Electronics and Telecommunications Research Institute was tuned, and the top-plate vibration of the isolation table was inspected in the three axes X/Y/Z to verify that it meets the equipment vibration specification (Section 9).
The 1st tuning (2026.11.09) was performed with the customer equipment turned off, and re-tuning (2nd, 2026.11.10) was performed after the customer equipment was turned on. The measurement data in this report are the values with the customer equipment turned on after the 2nd tuning.
The data are presented as Autospectrum, and 1/3 octave VC Curves and Reference materials on vibration levels are also provided.
Vibration Isolation Table
Model: DVIA-P4000
Serial Number: 260731R1
Engineer
Donggyu Park
Gyumin Park
Changhyeon Moon
DAEIL SYSTEMS
Tuning Date
2026.11.09 (1st) / 2026.11.10 (2nd)
End User
Electronics and Telecommunications Research Institute (ETRI)
Tuning Round
2nd — re-tuning after the customer equipment was turned on (the 1st was performed with the customer equipment turned off)
Installation Site
Daejeon / Electronics and Telecommunications Research Institute Lab Building 4 / 1F Room G01 Clean Room
Customer Equipment
Manufacturer: JEOL
Equipment: E-Beam Lithography
Model: JBX-8100FS
Vibration Specification
Applied criterion: JEOL JBX-8100FS Installation Manual 7.2 Allowable Floor Vibration (At the bottom of the basic unit — bottom of the equipment = top plate of the isolation table). The breakpoints of the vibration specification graph were read in cm/s and converted to µm/s, and these values are used as the allowable limits for judgment.
| Frequency [Hz] | Allowable [µm/s] | Manual scale [cm/s] |
|---|---|---|
| 1 | 477 | 4.8×10⁻² |
| 2 | 81 | 8.1×10⁻³ |
| 3.5 | 45 | 4.5×10⁻³ |
| 8.8 | 92 | 9.2×10⁻³ |
| 10 | 42 | 4.2×10⁻³ |
| 12.6 | 32 | 3.2×10⁻³ |
| 15.3 | 157 | 1.6×10⁻² |
| 100 | 25 | 2.5×10⁻³ |
Judgment: PASS if the isolation table top-plate Autospectrum (FFT, Δf 0.0625 Hz, rms) is at or below the allowable limit over the entire 1 ~ 100 Hz band (log interpolation between breakpoints).
Equipment Status
Customer equipment turned on, isolation table Active ON (after the 2nd tuning, 2026.11.10)
Measurement Equipment · Setup
| Item | PULSE |
|---|---|
| Instrument · Software | B&K LAN-XI Type 3050-A-040 (4-ch Input Module) · B&K PULSE LabShop 22.2 |
| Sensor | PCB 393B05 accelerometer × 2 |
| Measurement Position | P1 Floor / P2 Isolation table top plate — 2-channel simultaneous measurement |
| Measured Axis | X (Left-Right) / Y (Front-Back) / Z (Vertical) — sequential measurement per axis |
| Measurement Runs · Time | Z 4 runs · X 3 runs · Y 3 runs — 2026.11.10 11:00 ~ 15:00 |
| Frequency Span | 200 Hz · Lines 3200 (Δf 0.0625 Hz, Record Length 16 s) |
| Window | Hanning |
| Averaging | Ambient · Average — FFT Spectrum Averaging / CPB (1/3 Octave) Spectrum Averaging, averaging time per run 36 ~ 128 s |
| Engineering Unit | m/s² (measured and stored as acceleration) — velocity µm/s converted at FFT line · 1/3 octave band frequency (v = a / 2πf) |
| Analysis | FFT Autospectrum — judgment, 1 ~ 100 Hz · 1/3 Octave (CPB) — VC Curve reference, 1 ~ 100 Hz |
Conclusion
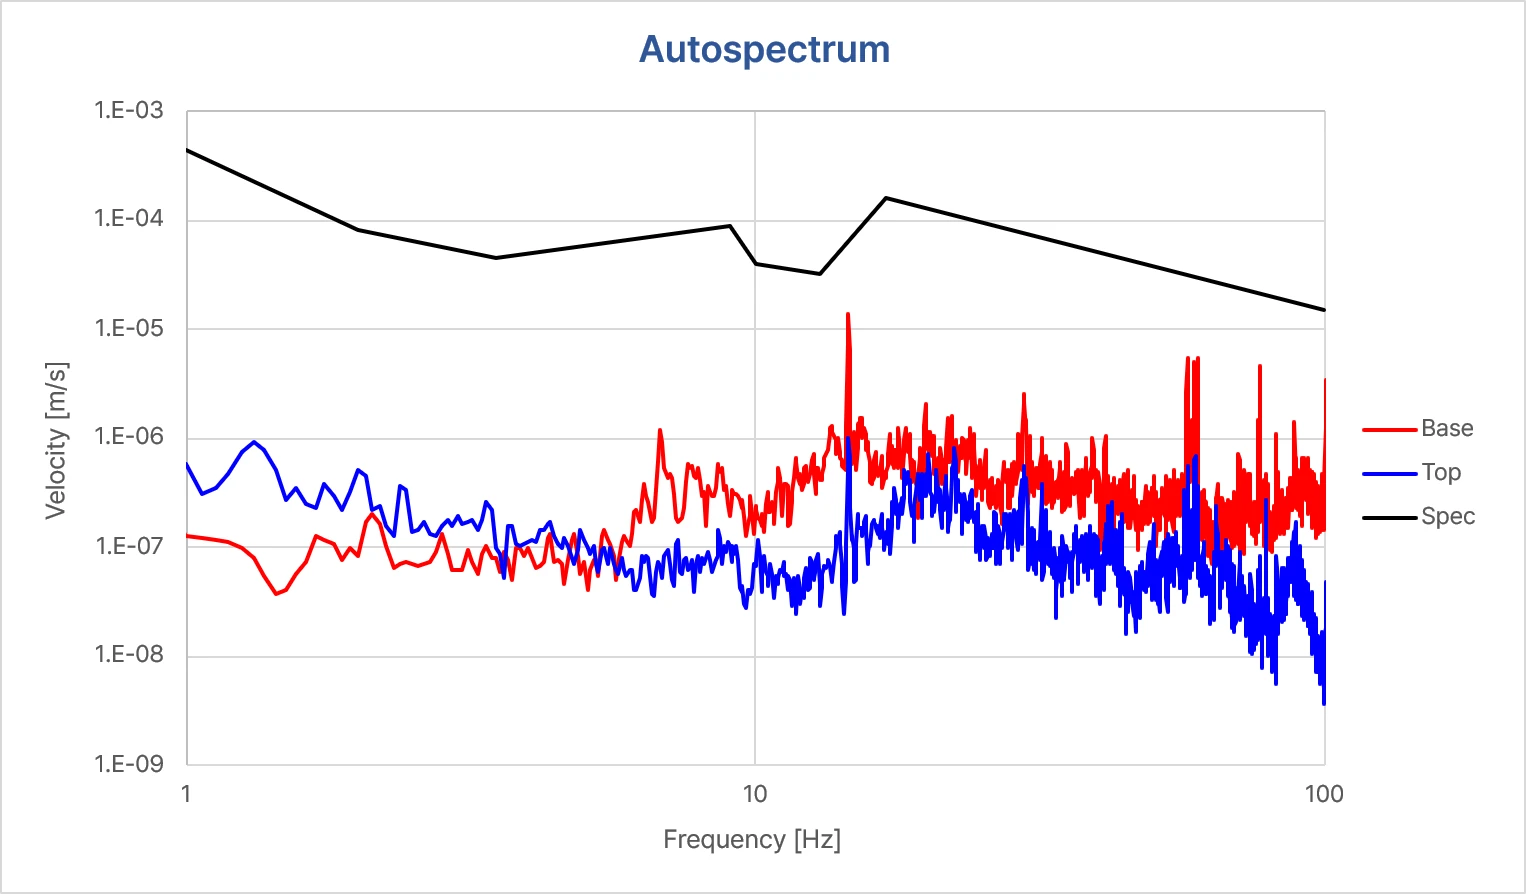
After the 2nd tuning (customer equipment turned on), the top-plate vibration of the isolation table was below the JBX-8100FS allowable velocity curve over 1 ~ 100 Hz, PASS in all three axes, with a maximum of 5.6 % of the allowable limit (Vertical, 59.3 Hz).
Measurement Data Summary
| Measured Axis | Vibration Specification | Measurement Result (DVIA-P4000 top plate) | Allowable (same frequency) | Ratio to Allowable | Judgment |
|---|---|---|---|---|---|
| Vertical (Z) | Section 9 allowable velocity curve (JBX-8100FS) | 2.34 µm/s @ 59.3 Hz | 41.7 µm/s | 5.6 % | ✓ PASS |
| Left-Right (X) | 1.67 µm/s @ 28.3 Hz | 86.0 µm/s | 1.9 % | ✓ PASS | |
| Front-Back (Y) | 1.48 µm/s @ 80.2 Hz | 31.0 µm/s | 4.8 % | ✓ PASS |
The measurement result is the top-plate velocity (FFT line rms) at the point with the largest ratio to the allowable limit among the repeated measurements per axis (Z 4 · X 3 · Y 3), and all repeated runs were PASS. For the floor (P1) values, refer to the measurement data graphs.
Measurement Data
Vertical (Z-axis) — After 2nd Tuning
After 2nd Tuning – Vertical (Z-axis) – Autospectrum (SPEC: JBX-8100FS Allowable Velocity)
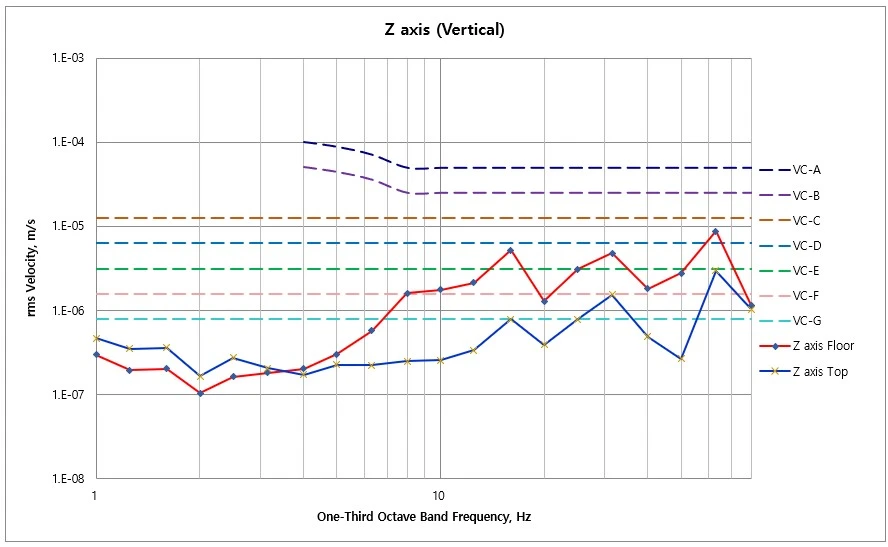
After 2nd Tuning – Vertical (Z-axis) – VC Curves
Left-Right (X-axis) — After 2nd Tuning
After 2nd Tuning – Left-Right (X-axis) – Autospectrum (SPEC: JBX-8100FS Allowable Velocity)
After 2nd Tuning – Left-Right (X-axis) – VC Curves
Front-Back (Y-axis) — After 2nd Tuning
After 2nd Tuning – Front-Back (Y-axis) – Autospectrum (SPEC: JBX-8100FS Allowable Velocity)
After 2nd Tuning – Front-Back (Y-axis) – VC Curves
Installation Photos
Photo Not Allowed
As on-site photography was not permitted, the installation status is described instead of photos. The DVIA-P4000 isolation table is installed in the 1F Room G01 clean room of Lab Building 4 at the Electronics and Telecommunications Research Institute, and the JEOL JBX-8100FS (E-Beam Lithography) is seated on the top plate of the isolation table.
Reference
The table below is the vibration level classification of IEST-RP-CC012.2.
¹ Measured in 1/3 octave bands over 8~80 Hz (VC-A and VC-B) or 1~80 Hz (VC-C~VC-G).
² Detail size indicates line width in microelectronics manufacturing, particle (cell) size in medical and pharmaceutical research, etc. It is not relevant to imaging associated with probe technologies, AFMs, and nanotechnology.
The information provided in this table is for reference. In most cases, it is recommended to seek advice from an expert who is well familiar with the application of the equipment and process and its vibration requirements.
Share this Case Study
Case Study Information
Related Case Studies
Korea Institute of Science and Technology JEOL JBX-A9 E-Beam Lithography DVIA-P4000 Installation Report
ETRI JEOL JBX-8100FS DVIA-P2200 Installation Report