Tier-1 Semiconductor ZEISS X-ray Microscope DVIA-ULF1500 Installation Report
Contents
Overview
This report describes the tuning and vibration measurement results for the DVIA-ULF1500 that was relocated and installed in the mass production quality team cleanroom on the 6th floor of the C3 line.
The measurement was performed with the active vibration isolation of the platform running (Active On), and the vibration reduction effect was comparatively analyzed on the base (Base) and top (Top) of the platform. The upper equipment, the ZEISS Xradia 730 Versa, was also inspected and measured in the powered-on (Turn On) state. The measurement point was selected as the central point between the two ULF modules, and the three axes — vertical (Z-axis), left-to-right (X-axis), and front-to-back (Y-axis) — were measured at that point.
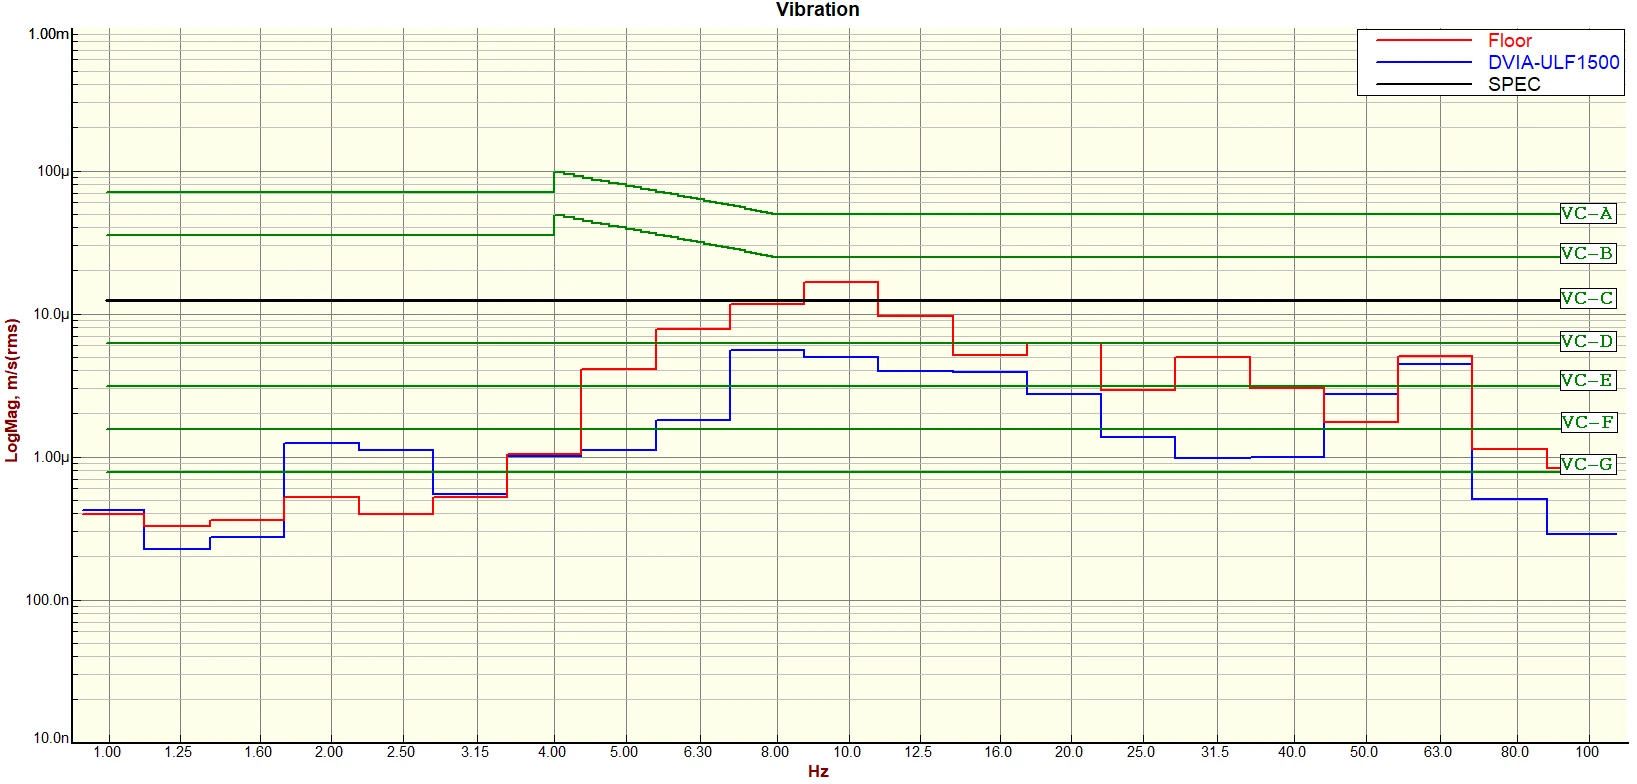
The measurement data are presented in VC Curve format, plotted together with the installation vibration requirement (Installation Requirement) provided by the equipment manufacturer as the SPEC baseline so that compliance can be compared directly. In addition, the classification criteria of Section 14, IEST-RP-CC012.2, are provided as reference material for the current vibration level.
Vibration Isolation System Information
Model: DVIA-ULF1500
Serial Number: 260402R2
Engineer
Taehun Kim · DAEIL SYSTEMS
Tuning Date
2026.09.11
Installation Site
Mass production quality team line cleanroom, 6th floor of the C3 line
End User Equipment
Manufacturer: ZEISS
Equipment: X-ray Microscope
Model: Xradia 730 Versa
Vibration Specification
VC-C
Equipment Condition
Turn on
Vibration Measurement Equipment
9.1) Measurement Equipment
Hardware: Bruel & Kjaer Type 3050-A-040
Software: Pulse 22
9.2) Accelerometer
PCB Accelerometer 393B05, 2 EA (Top, Base)
Vibration Measurement Setup
F Span: 200 Hz
Lines: 2400
Engineering Units: m/s
Window: Hanning
Averaging: FFT Spectrum Averaging
Conclusion
This measurement was carried out, after the completion of tuning of the DVIA-ULF1500 relocated and installed in the mass production quality team cleanroom on the 6th floor of the C3 line, to quantitatively confirm the vibration reduction effect in the active vibration isolation operating state.
As a result of the measurement, at the central point between the two ULF modules the floor vibration was effectively reduced, satisfying the specification on all axes, and was confirmed to be within the VC-C grade. The effect of active vibration isolation was confirmed in the low-frequency region where passive reduction is limited.
Since this system is structured such that the two ULF modules interact through the upper equipment, the vibration performance judgment was made on the basis of the central point between the two modules where the equipment is actually supported, and at that reference point the VC-C grade is satisfied on all axes. No vibration-induced limiting factors were observed in the operation of the ZEISS equipment under the current installation state.
[Follow-up Action Plan]
If vibration-induced performance anomalies are confirmed during future equipment operation, spring adjustment and re-tuning will be performed through an on-site visit.
This judgment is based on the environmental conditions at the time of measurement. Since vibration levels may change when the equipment operating conditions or the installation environment (addition of adjacent equipment, air conditioning, utility changes, etc.) vary, re-measurement is recommended when the environment changes.
Measurement Data Summary
| Measurement Point | Vibration Specification | Measurement Axis | Measurement Result | |
|---|---|---|---|---|
| Floor | DVIA-ULF1500 | |||
| 1. Floor 2. DVIA-ULF1500 | See Section 8 | Vertical (Z-axis) | ✗ FAIL | ✓ PASS |
| Left to Right (X-axis) | ✗ FAIL | ✓ PASS | ||
| Front to Back (Y-axis) | ✓ PASS | ✓ PASS | ||
Measurement Data
Z-axis — VC Curves
X-axis — VC Curves
Y-axis — VC Curves
Reference
The table below classifies vibration levels based on IEST-RP-CC012.2.
Notes:
1. As measured in one-third octave bands of frequency over the frequency 8 to 80 Hz (VC-A and VC-B) or 1 to 80 Hz (VC-C through VC-G).
2. The detail size refers to the width in the case of microelectronics fabrication, the particle (cell) size in the case of medical and pharmaceutical research, etc. It is to imaging associated with probe technologies, AFMs, and nanotechnology.
The information in this table is provided for reference. In most cases it is advisable to seek the advice of a specialist familiar with the application and the vibration requirements of the equipment and process.