QRT MST8500 Probe Station DVIA-T67 (250204R2) Installation Report
Contents
Customer
QRT
Author
Engineer: Chaewon Lee
Measurement date: May 13, 2025
Report written date: May 13, 2025
Overview
Tuning and vibration measurement were requested and performed for the DVIA-T67 delivered to the 3F QRT lab at Korea Institute of Nano Technology, aligned with on-site probing characteristics.
After the equipment was installed, tuning and vibration measurement were performed with the equipment Turned on.
Unlike the tuning performed on March 14, 2025, this tuning focused on overall isolator performance improvement rather than optimization for a specific probing environment.
Data are presented as VC curves, and Reference materials are provided for the vibration levels.
Vibration Isolation Platform
Model: DVIA-T67
Serial number: 250204R2
Engineer
Jonghwa Suh, field engineer, DAEIL SYSTEMS
Measurement Date
May 13, 2025
Installation Site
Korea Institute of Nano Technology, 3F QRT
End User
QRT
Equipment Status
Equipment installed / Operation
Customer Equipment
Manufacturer: MSTech
Equipment: Probe Station
Model: MST8500
Vibration specification
Not held by customer
Measuring Equipment
10.1) Data Physics DAQ
-Hardware: QUATTRO, Serial Number: 22436
-Software: SignalCalc ACE
10.2) Accelerometer
PCB Accelerometer
Model: 393B05
Vibration Measurement Setup
F Span: 200
Lines: 3200
Engineering Units: m/s
Window: Hanning
Averaging: FFT Spectrum Averaging
Average Mode: Exponential, 40
Conclusion
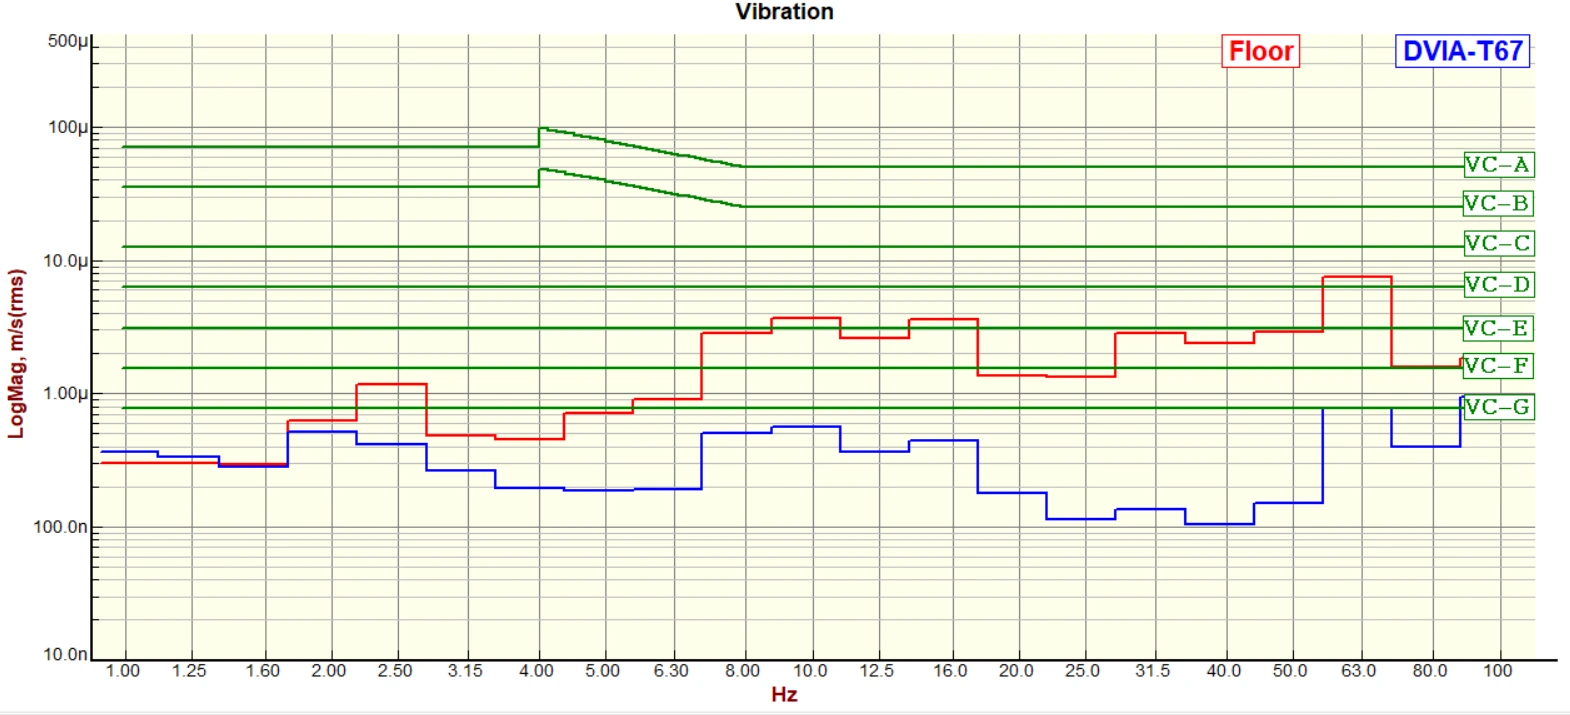
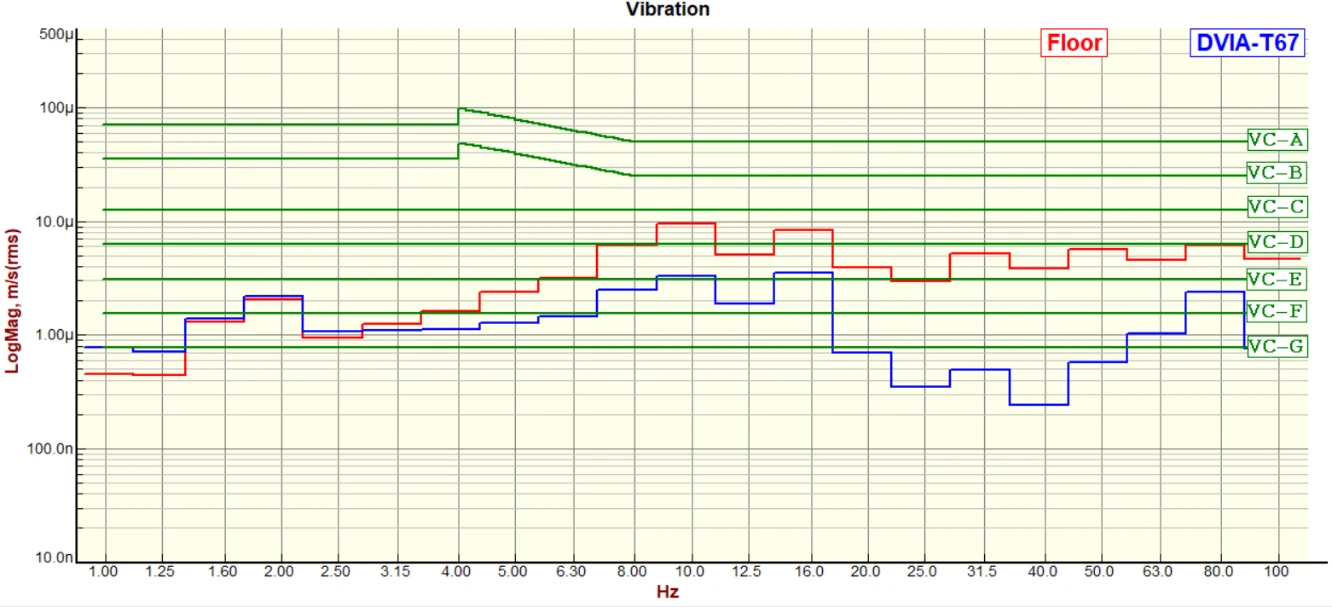
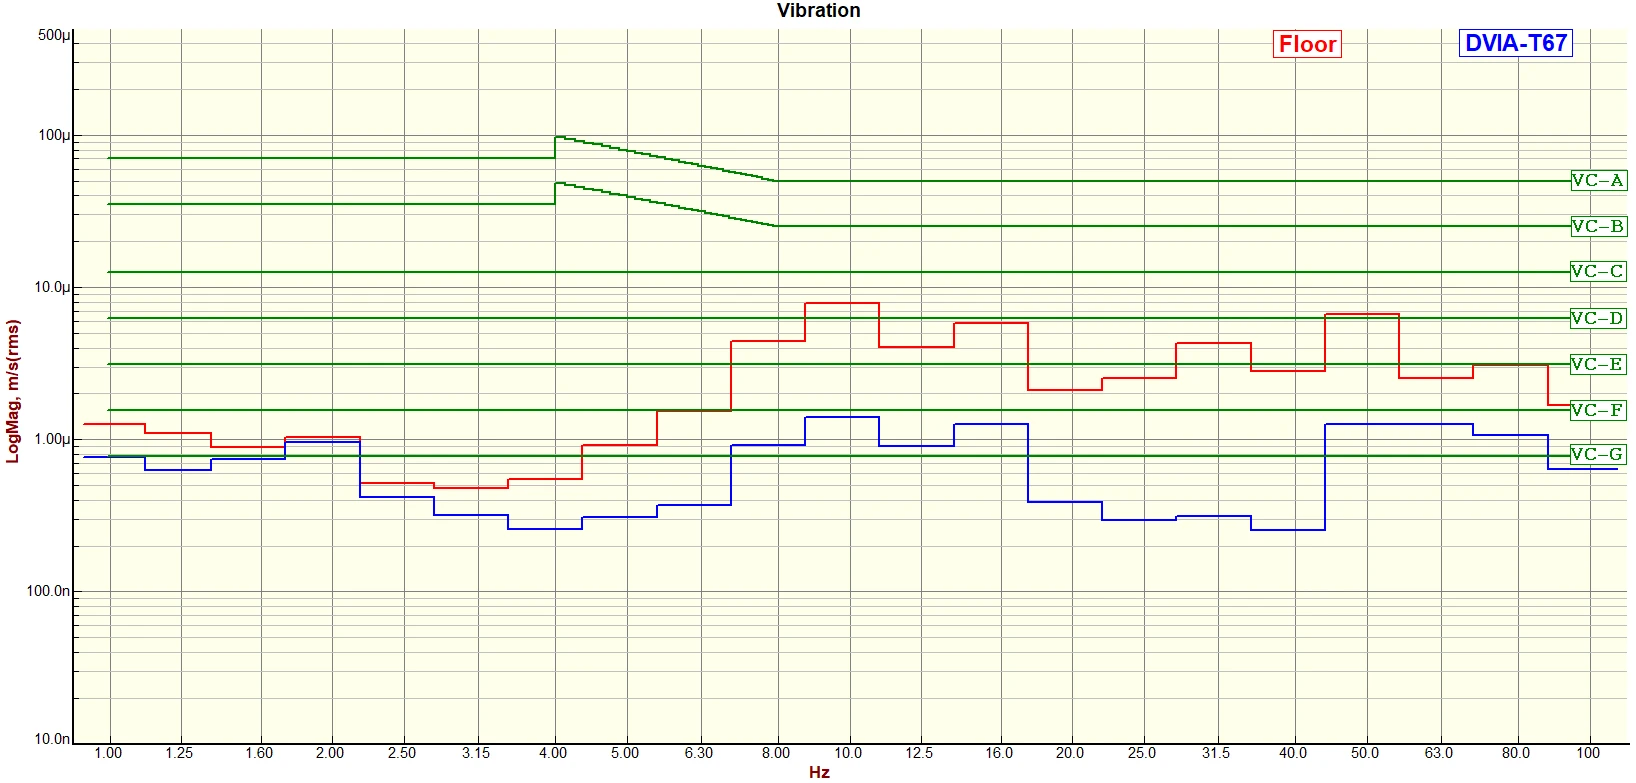
Vertical: vibration at VC-C at 10 Hz is attenuated to VC-F.
Left to Right: vibration at VC-B at 16 Hz is attenuated to VC-F.
Front to Back: vibration at VC-C at 20 Hz is attenuated to VC-G.
Compared with data from March 14, 2025, performance increased overall in all directions.
Measurement Data
| Place of Measurement | Status | Direction | Floor | DVIA-T67 |
|---|---|---|---|---|
| Korea Institute of Nano Technology 3F QRT lab 1. Floor 2. DVIA-T67 | Equipment installed/Operation | Vertical | VC-C@ 10 Hz | VC-F@ 10 Hz |
| Left to Right | VC-B@ 16 Hz | VC-F@ 16 Hz | ||
| Front to Back | VC-C@ 20 Hz | VC-G@20 Hz |
Data and Image
Vertical VC Curves
Vertical Autospectrum
Vertical Transmissibility
Left to Right VC Curves
Left to Right Autospectrum
Left to Right Transmissibility
Front to Back VC Curves
Front to Back Autospectrum
Front to Back Transmissibility
Equipment Photo
Reference
Generic Vibration Criteria
Notes:
- As measured in one-third octave bands over 8-80 Hz (VC-A/B) or 1-80 Hz (VC-C through VC-G).
- Detail size refers to width in microelectronics fabrication or particle size in medical research.
Share this Case Study
Case Study Information
Related Case Studies
QRT DVIA-T67 (250204R2) Installation Report — MSTech MST8500 Probe Station
QRT MST8500 Probe Station DVIA-T67 (250204R2) Installation Report