KIMM DVIA-PB2200 High-Frequency Amplification Issue Field Analysis Report (VOC26-049)
Contents
Report Information
Report title: VOC26-049 – Korea Institute of Machinery & Materials, Field Analysis Report
Vibration isolation system: DVIA-PB2200, serial number 250122R1-1
Task leader: Sungyoon Jung
Engineers in charge: Donhyuk Jeon, Sungyoon Jung, Gyumin Park
Author: Sungyoon Jung
Report written date: 2026-07-07
Overview
Background and Objective
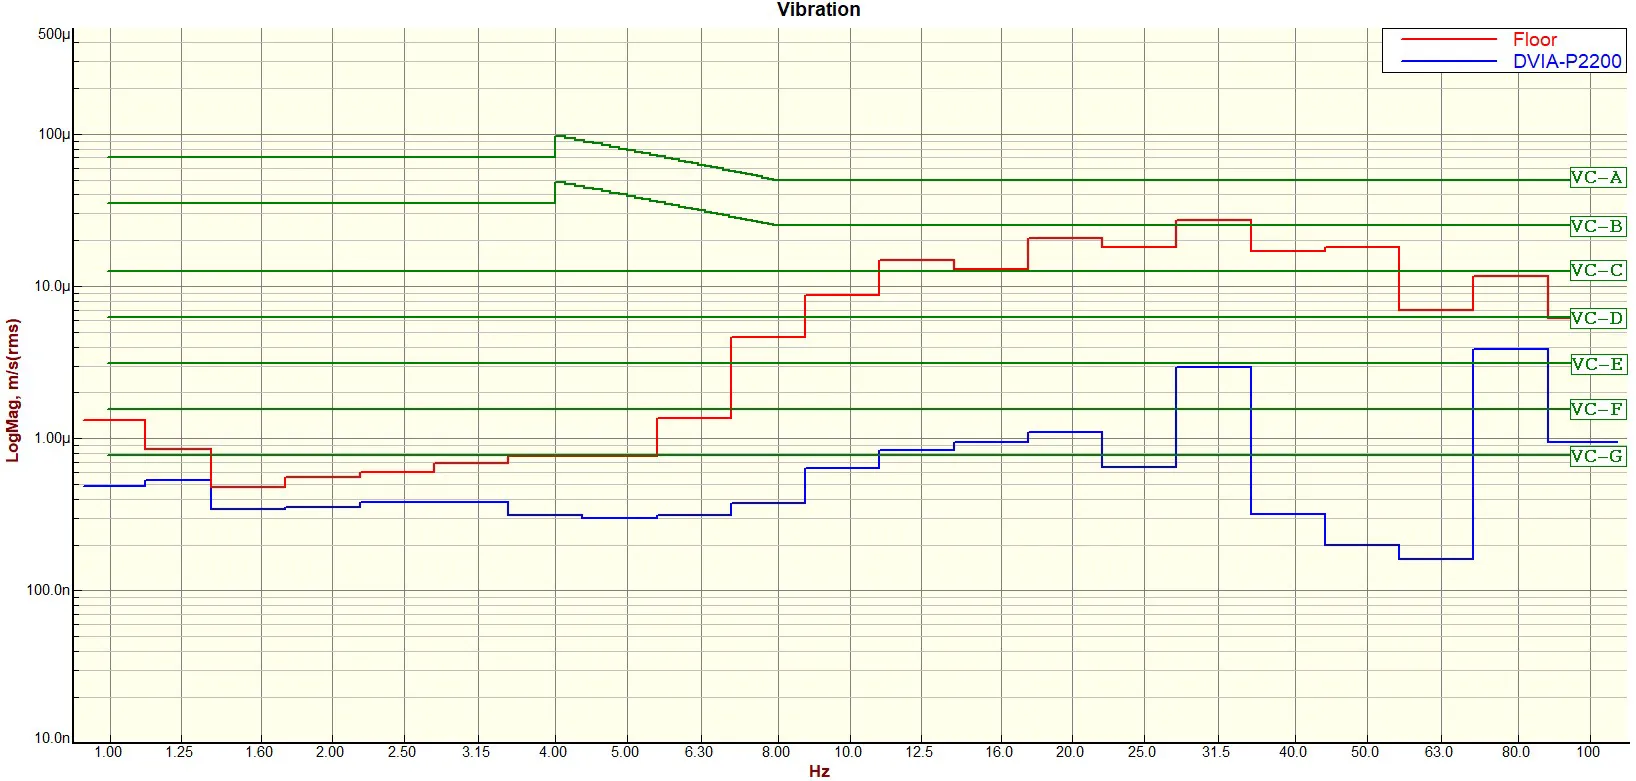
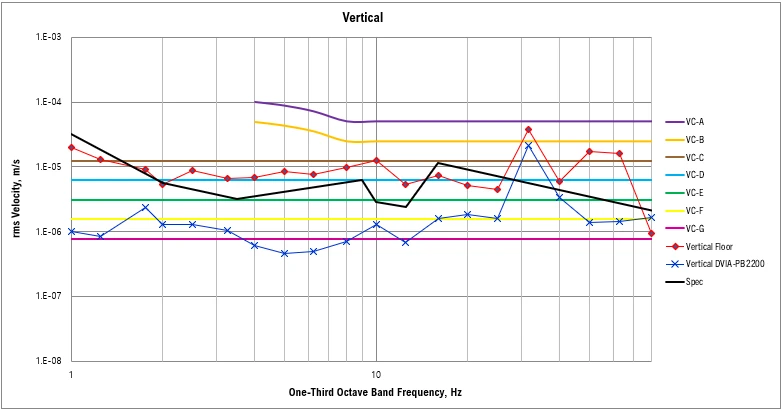
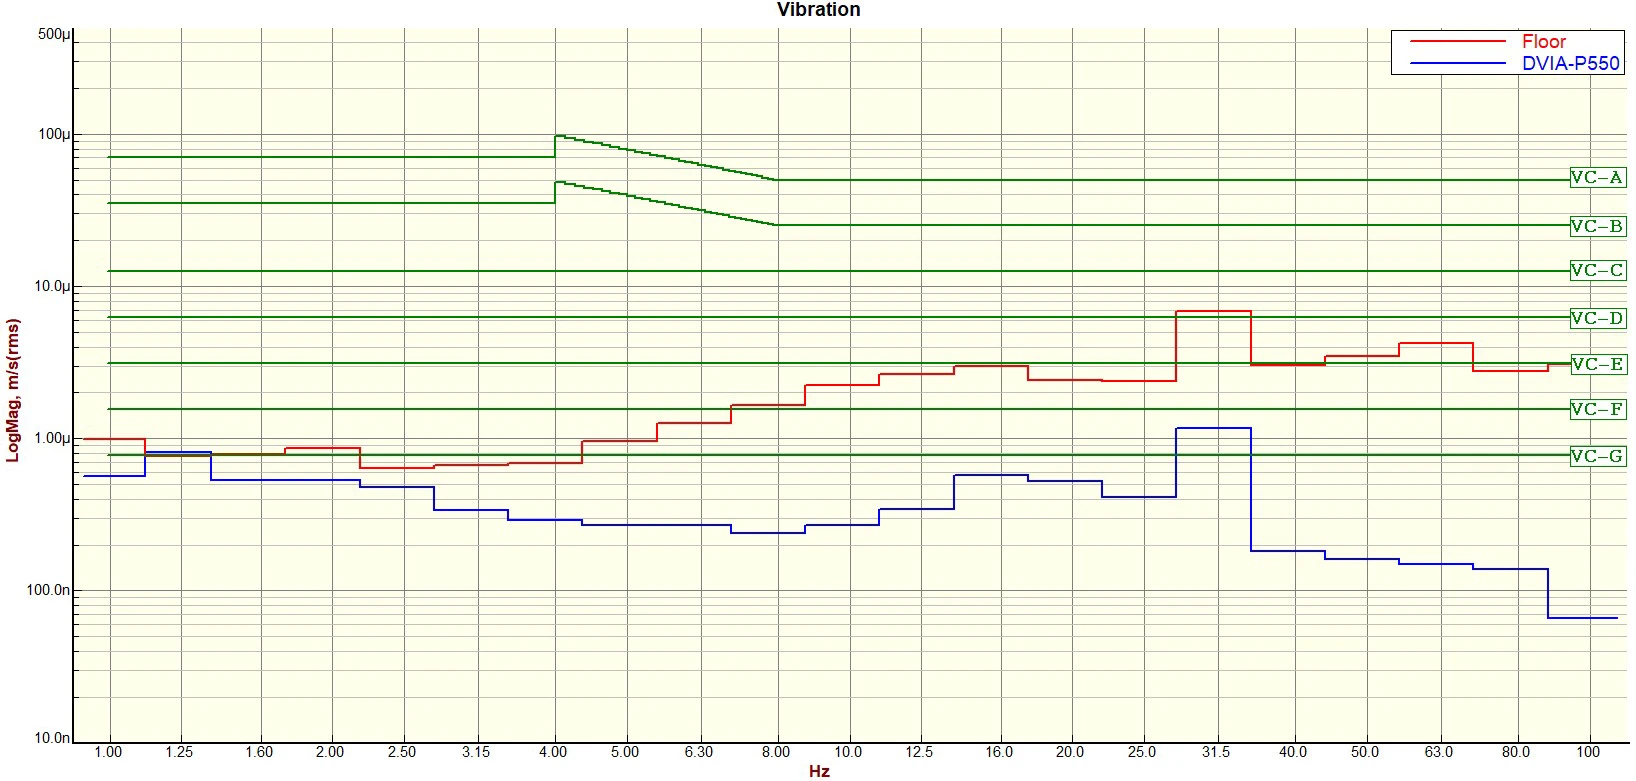
This report was prepared to present the field measurement results and the technical root-cause analysis for the peak issue (VOC26-049) that occurred on the DVIA-PB2200 delivered to Korea Institute of Machinery & Materials (KIMM), in specific frequency bands (28 Hz on the X axis, 50 to 90 Hz on the X/Y/Z axes).
Table 1 Field Measurement Data (DVIA-PB2200)
Passive, Left to Right (28 Hz resonance peak)
Passive, Front to Back (70 Hz resonance peak)
Figure 1 X and Y Axis Definition
Field Measurement and Test Conditions
Vibration data were collected during a site visit on the actual unit (PB2200) while the support condition was varied.
Measurement items: Compliance, Passive transmissibility, Open-Loop frequency response function, Autospectrum, VC Curves
Support condition variations: 1) Levelfoot and Footmaster supporting together, 2) Levelfoot only (Footmaster removed), 3) Footmaster only
Instrumentation used: PULSE 22, Impact Hammer, accelerometer (PCB 393B05)
Key Measurement Results and Phenomenon Analysis
28 Hz Peak on the X Axis
Independence from the support condition: even when the floor support method was changed (Levelfoot, Footmaster and so on), the 28 Hz peak was confirmed to occur consistently on the X axis only. (It does not appear on the Y axis, and the amplification ratio on the Z axis is very low.)
Site Setup, Condition 1 (Levelfoot and Footmaster)
Site Setup, Condition 2 (Levelfoot) — the same value was measured even with the Footmaster removed
Site Setup, Condition 3 (Footmaster)
Estimated Cause
Open-Loop phase analysis: at that frequency (28 Hz), the phase of the open-loop frequency response function crosses 0 degrees (phase crossover). In control engineering terms this is evidence of a structural resonance. In other words, the peak occurring in the 28 Hz band is not a malfunction of the active control system of the isolator or a software error. An abrupt phase change in the open loop means a structural resonance arising in a particular mechanical part of the overall system, that is the payload on top or the isolator table top coupled to it.
Figure 3 Open-Loop Frequency Response Function, X Axis (Levelfoot and Footmaster support condition)
Mathematical and Physical Principle
When the equation of motion of a single-degree-of-freedom mass-spring-damper (m-k-c) model is transformed into the frequency domain (s = jω), the denominator of the transfer function takes the following form: Denominator = k − mω² + jcω
Why the magnitude peak occurs: when the excitation frequency (ω) reaches the natural frequency (ωn = √(k/m)), the real part becomes 0 and takes its minimum value. When the denominator is minimum, the response magnitude forms its maximum value (peak).
Why the phase crossover occurs: the phase is determined by the ratio of the real part to the imaginary part, atan(cω / (k − mω²)). Below the natural frequency the real part is positive; above the natural frequency the real part is negative; at the natural frequency the real part passes through 0.
Equipment-dependent phenomenon (vibration transmitted from the payload): the fact that this peak appears independently and only in the X-axis direction regardless of the support condition suggests a high probability that an eccentric center of gravity of the payload itself, or structural shaking of an internal component (for example a vacuum pump), is being transmitted into the isolator table top.
Proposed follow-up verification (how to confirm the payload factor): the most reliable way to cross-check intuitively that this phenomenon comes from the structural directivity of the payload itself (a difference in X-axis and Y-axis stiffness) rather than from the isolator is proposed as follows. If the piping and wiring constraints of the payload allow it, the payload can be rotated 90 degrees using the Footmaster and measured in the same way. If the 30 Hz peak that used to occur on the X axis then appears on the Y axis after the rotation, this confirms with certainty that it is a characteristic of the payload itself (an equipment issue).
50 to 90 Hz Band Peak
Measurement result: as the support condition (the floor support position of the Levelfoot, Footmaster and so on) was changed, a tendency for the resonance peak frequencies in the 50 to 90 Hz band to shift was observed. When both the Levelfoot and the Footmaster were lowered, the number of resonance peaks decreased. The more support points there are, the higher the resonance frequency rises.
Cause analysis: this tendency agrees with in-house testing and simulation (FEM) results, and is judged to be a mechanical structural resonance of the table top depending on the payload coupling condition.
FEM simulation conditions: the payload is assumed rigid, and the support parts of the payload (the parts emulating the Levelfoot and Footmaster) are assumed to be steel.
Table 3 Modal FEM Results for the Table Top by Support Condition
| Table top only | Condition 1 (Levelfoot and Footmaster) | Condition 2 (Levelfoot) | Condition 3 (Footmaster) |
|---|---|---|---|
| 59 Hz | 74 Hz | 63 Hz | 70 Hz |
Table 4 Modal FEM Result, Table Top Only
FEM Model, Table Top Only (no supports)
First Natural Frequency 59 Hz
Table 5 FEM Simulation Emulating Levelfoot and Footmaster Support
Site Setup, Levelfoot and Footmaster
Inner and Outer Both Supported, First Natural Frequency 74.1 Hz
Table 6 FEM Simulation Emulating Levelfoot Support
Site Setup, Levelfoot
Simulated support spacing 1055 mm and 965 mm, simulated Levelfoot diameter 80 mm, First Natural Frequency 62.7 Hz
Table 7 FEM Simulation Emulating Footmaster Support
Site Setup, Footmaster
Inner and Outer Both Supported, First Natural Frequency 70.4 Hz
Overall Measurement Data and Installation Environment Check
Equipment Setup and External Environment Check
Levelness
The photographs attached below show the levelness of the isolator table top; in addition, the levelness of the payload was confirmed to be at the 0 mm/min level.
Y Direction, 4 mm/m
Diagonal Direction, 0 mm/m
X Direction, 4 mm/m
Center of Gravity (Degree of Eccentricity)
The side chamber weighs 50 kg or less in total, which is very light compared with the equipment weight. The amount of eccentricity is negligible.
Figure 4 Vacuum Pump on the Side of the Payload, Pfeiffer (model name: HiPace 2300 U)
Noise
Noise measurement was performed at the center of the isolator table top. The measured 12.5 Hz noise was below 30 dB, a very small level. Therefore noise is not the cause of the 12.5 Hz active transmissibility amplification.
Figure 5 Noise Measurement Test Scene
Table 8 Noise Measurement Data
Trial 1
Trial 2
Trial 3
Open-Loop Frequency Response Function
After removing all filters, the open-loop frequency response function was measured for each support condition.
Open-Loop FRF, Z Axis, Condition 1 (Levelfoot and Footmaster)
Open-Loop FRF, Z Axis, Condition 2 (Levelfoot)
Open-Loop FRF, Z Axis, Condition 3 (Footmaster)
Open-Loop FRF, P Axis, Condition 1 (Levelfoot and Footmaster)
Open-Loop FRF, P Axis, Condition 2 (Levelfoot)
Open-Loop FRF, P Axis, Condition 3 (Footmaster)
Open-Loop FRF, R Axis, Condition 1 (Levelfoot and Footmaster)
Open-Loop FRF, R Axis, Condition 2 (Levelfoot)
Open-Loop FRF, R Axis, Condition 3 (Footmaster)
Open-Loop FRF, X Axis, Condition 1 (Levelfoot and Footmaster)
Open-Loop FRF, X Axis, Condition 2 (Levelfoot)
Open-Loop FRF, X Axis, Condition 3 (Footmaster)
Open-Loop FRF, Y Axis, Condition 1 (Levelfoot and Footmaster)
Open-Loop FRF, Y Axis, Condition 2 (Levelfoot)
Open-Loop FRF, Y Axis, Condition 3 (Footmaster)
Open-Loop FRF, W Axis, Condition 1 (Levelfoot and Footmaster)
Open-Loop FRF, W Axis, Condition 2 (Levelfoot)
Open-Loop FRF, W Axis, Condition 3 (Footmaster)
Table 9 Open-Loop Frequency Response Function Measurements (peak frequencies, Hz)
| Condition 1 (Levelfoot and Footmaster) | Condition 2 (Levelfoot) | Condition 3 (Footmaster) |
|---|---|---|
| Z: 4.51, 28, 85.3 P: 2.56, 8.78, 27.8, 52.2, 67.7, 93.2 R: 2.93, 9.27, 61.15, 85.32, 93.26 X: 9.15, 27.83, 47.97, 52.36, 68.23 Y: 9.39, 61.27, 93.26 W: 7.69, 22.82, 75.07 | Z: 4.63, 27.71, 56.64 P: 2.56, 8.17, 27.71, 39.67, 56.64, 87.40 R: 2.93, 9.39, 45.28, 56.88, 82.03 X: 8.66, 27.58, 39.79, 55.54, 82.27 Y: 2.8, 9.27, 45.16, 87.52 W: 7.44, 22.82, 15.03 | Z: 4.63, 27.7, 83.61 P: 2.8, 8.78, 27.71, 35.27, 51.14, 79.34 R: 2.93, 8.91, 35.4 X: 9.03, 27.71, 35.15, 51.51, 54.56 Y: 9.27, 22.82, 35.4, 51.51, 54.93 W: 7.32, 22.82, 35.03, 19.88, 83.49 |
Passive Transmissibility
Passive Transmissibility, Z Axis, Condition 1 (Levelfoot and Footmaster)
Passive Transmissibility, Z Axis, Condition 2 (Levelfoot)
Passive Transmissibility, Z Axis, Condition 3 (Footmaster)
Passive Transmissibility, X Axis, Condition 1 (Levelfoot and Footmaster)
Passive Transmissibility, X Axis, Condition 2 (Levelfoot)
Passive Transmissibility, X Axis, Condition 3 (Footmaster)
Passive Transmissibility, Y Axis, Condition 1 (Levelfoot and Footmaster)
Passive Transmissibility, Y Axis, Condition 2 (Levelfoot)
Passive Transmissibility, Y Axis, Condition 3 (Footmaster)
Table 10 Passive Transmissibility Measurements (peak frequencies)
| Condition 1 (Levelfoot and Footmaster) | Condition 2 (Levelfoot) | Condition 3 (Footmaster) |
|---|---|---|
| Z: 4.75, 27.9, 83.7 Hz X: 9.19, 27.9, 50.9, 58.4 Hz Y: 9.63, 53.4, 58.9, 83.2 Hz | Z: 4.69, 27.6, 39.6, 56 Hz X: 9.13, 27.8, 40 Hz Y: 9.44, 43.5 Hz | Z: 4.56, 27.8, 51.1, 54.9, 83.3 Hz X: 9.1, 27.8, 35.8, 51.6, 54.9, 83.6 Hz Y: 9.56, 35.6 54.9, 83.7 Hz |
Autospectrum
Autospectrum, Z Axis, Condition 1 (Levelfoot and Footmaster)
Autospectrum, Z Axis, Condition 2 (Levelfoot)
Autospectrum, Z Axis, Condition 3 (Footmaster)
Autospectrum, X Axis, Condition 1 (Levelfoot and Footmaster)
Autospectrum, X Axis, Condition 2 (Levelfoot)
Autospectrum, X Axis, Condition 3 (Footmaster)
Autospectrum, Y Axis, Condition 1 (Levelfoot and Footmaster)
Autospectrum, Y Axis, Condition 2 (Levelfoot)
Autospectrum, Y Axis, Condition 3 (Footmaster)
VC Curves
VC Curves, Z Axis, Condition 1 (Levelfoot and Footmaster)
VC Curves, Z Axis, Condition 2 (Levelfoot)
VC Curves, Z Axis, Condition 3 (Footmaster)
VC Curves, X Axis, Condition 1 (Levelfoot and Footmaster)
VC Curves, X Axis, Condition 2 (Levelfoot)
VC Curves, X Axis, Condition 3 (Footmaster)
VC Curves, Y Axis, Condition 1 (Levelfoot and Footmaster)
VC Curves, Y Axis, Condition 2 (Levelfoot)
VC Curves, Y Axis, Condition 3 (Footmaster)
Active On (Levelfoot and Footmaster Support)
VC Curves, Z Axis
Autospectrum, Z Axis
Transmissibility, Z Axis
VC Curves, X Axis
Autospectrum, X Axis
Transmissibility, X Axis
VC Curves, Y Axis
Autospectrum, Y Axis
Transmissibility, Y Axis
Table 14 Comparison of Vibration Measurements by Condition
Passive vs Active Comparison, Z Axis
Comparison of Levelfoot, Footmaster and Levelfoot + Footmaster Support, Z Axis
Passive vs Active Comparison, X Axis
Comparison of Levelfoot, Footmaster and Levelfoot + Footmaster Support, X Axis
Passive vs Active Comparison, Y Axis
Comparison of Levelfoot, Footmaster and Levelfoot + Footmaster Support, Y Axis
Remarks
Passive vs Active comparison: blue is Active, red is Passive.
Support condition comparison: blue is Levelfoot and Footmaster, red is Levelfoot, black is Footmaster.
The resonance frequencies above 20 Hz are identical for Active and Passive.
The 28 Hz peak on the X axis occurs regardless of the support condition.
Compliance
Payload (Isolator Floating)
| Measurement location | X axis 28 Hz Compliance |
|---|---|
| Payload support frame | 409 nm/N |
| Pump drive structure | 5890 nm/N |
| Chamber middle | 332 nm/N |
| Chamber upper | 404 nm/N |
| Isolator table top | 68 nm/N |
| Isolator base plate | 80.2 nm/N |
Payload Support Frame
Measurement Point, Payload Support Frame
Measurement direction X axis, 28 Hz Compliance 289 nm/N
Pump Drive Structure
Measurement Point, Pump Drive Structure
Measurement direction Z axis, 28 Hz Compliance 1.63 um/N
Measurement direction X axis, 28 Hz Compliance 5.89 um/N
Chamber Middle
Measurement Point, Chamber Middle
Measurement direction X axis, 28 Hz Compliance 13.6 nm/N
Chamber Upper
Measurement Point, Chamber Upper
Measurement direction X axis, 28 Hz Compliance 217 nm/N
Payload (Isolator Off)
Payload Support Frame (Isolator Off)
Measurement direction Z axis, 29 Hz Compliance 655 nm/N
Measurement direction X axis, 30 Hz Compliance 409 nm/N
Chamber Middle (Isolator Off)
Measurement direction Z axis, 29 Hz Compliance 405 nm/N
Measurement direction X axis, 29 Hz Compliance 332 nm/N
Chamber Upper (Isolator Off)
Measurement direction Z axis, 29 Hz Compliance 640 nm/N
Measurement direction X axis, 29 Hz Compliance 404 nm/N
Isolator Table Top (Isolator Off)
Measurement direction Z axis, 29 Hz Compliance 908 nm/N
Measurement direction X axis, 29 Hz Compliance 68 nm/N
Isolator Base Plate (Isolator Off)
Measurement Point, Isolator Base Plate
Measurement direction X axis, 28 Hz Compliance 80.2 nm/N
Conclusion and Action Items
28 Hz peak issue — Cause: the 28 Hz peak that stands out in the X-axis direction is presumed to originate from the structural characteristics of the pump drive section of the payload.
28 Hz peak issue — Action item: a structural analysis of the customer's pump drive section is expected to clarify the cause definitively.
50 to 90 Hz band peak issue — Cause: taking the FEM analysis and the field measurement results together, the amplification in this band is presumed to be a structural resonance caused by insufficient stiffness of the isolator table top.
50 to 90 Hz band peak issue — Action item: a fundamental solution to this issue requires reinforcement of the table top stiffness or reinstallation work.
However, because the vibration amplification ratio and the absolute vibration magnitude are small, it is judged that there will be no problem with the customer's equipment operation. Large-scale hardware modification work such as table top reinforcement will therefore be carried out on a paid basis only if required.