KIMM High Vacuum Chamber DVIA-P2200 Installation Report
Contents
Overview
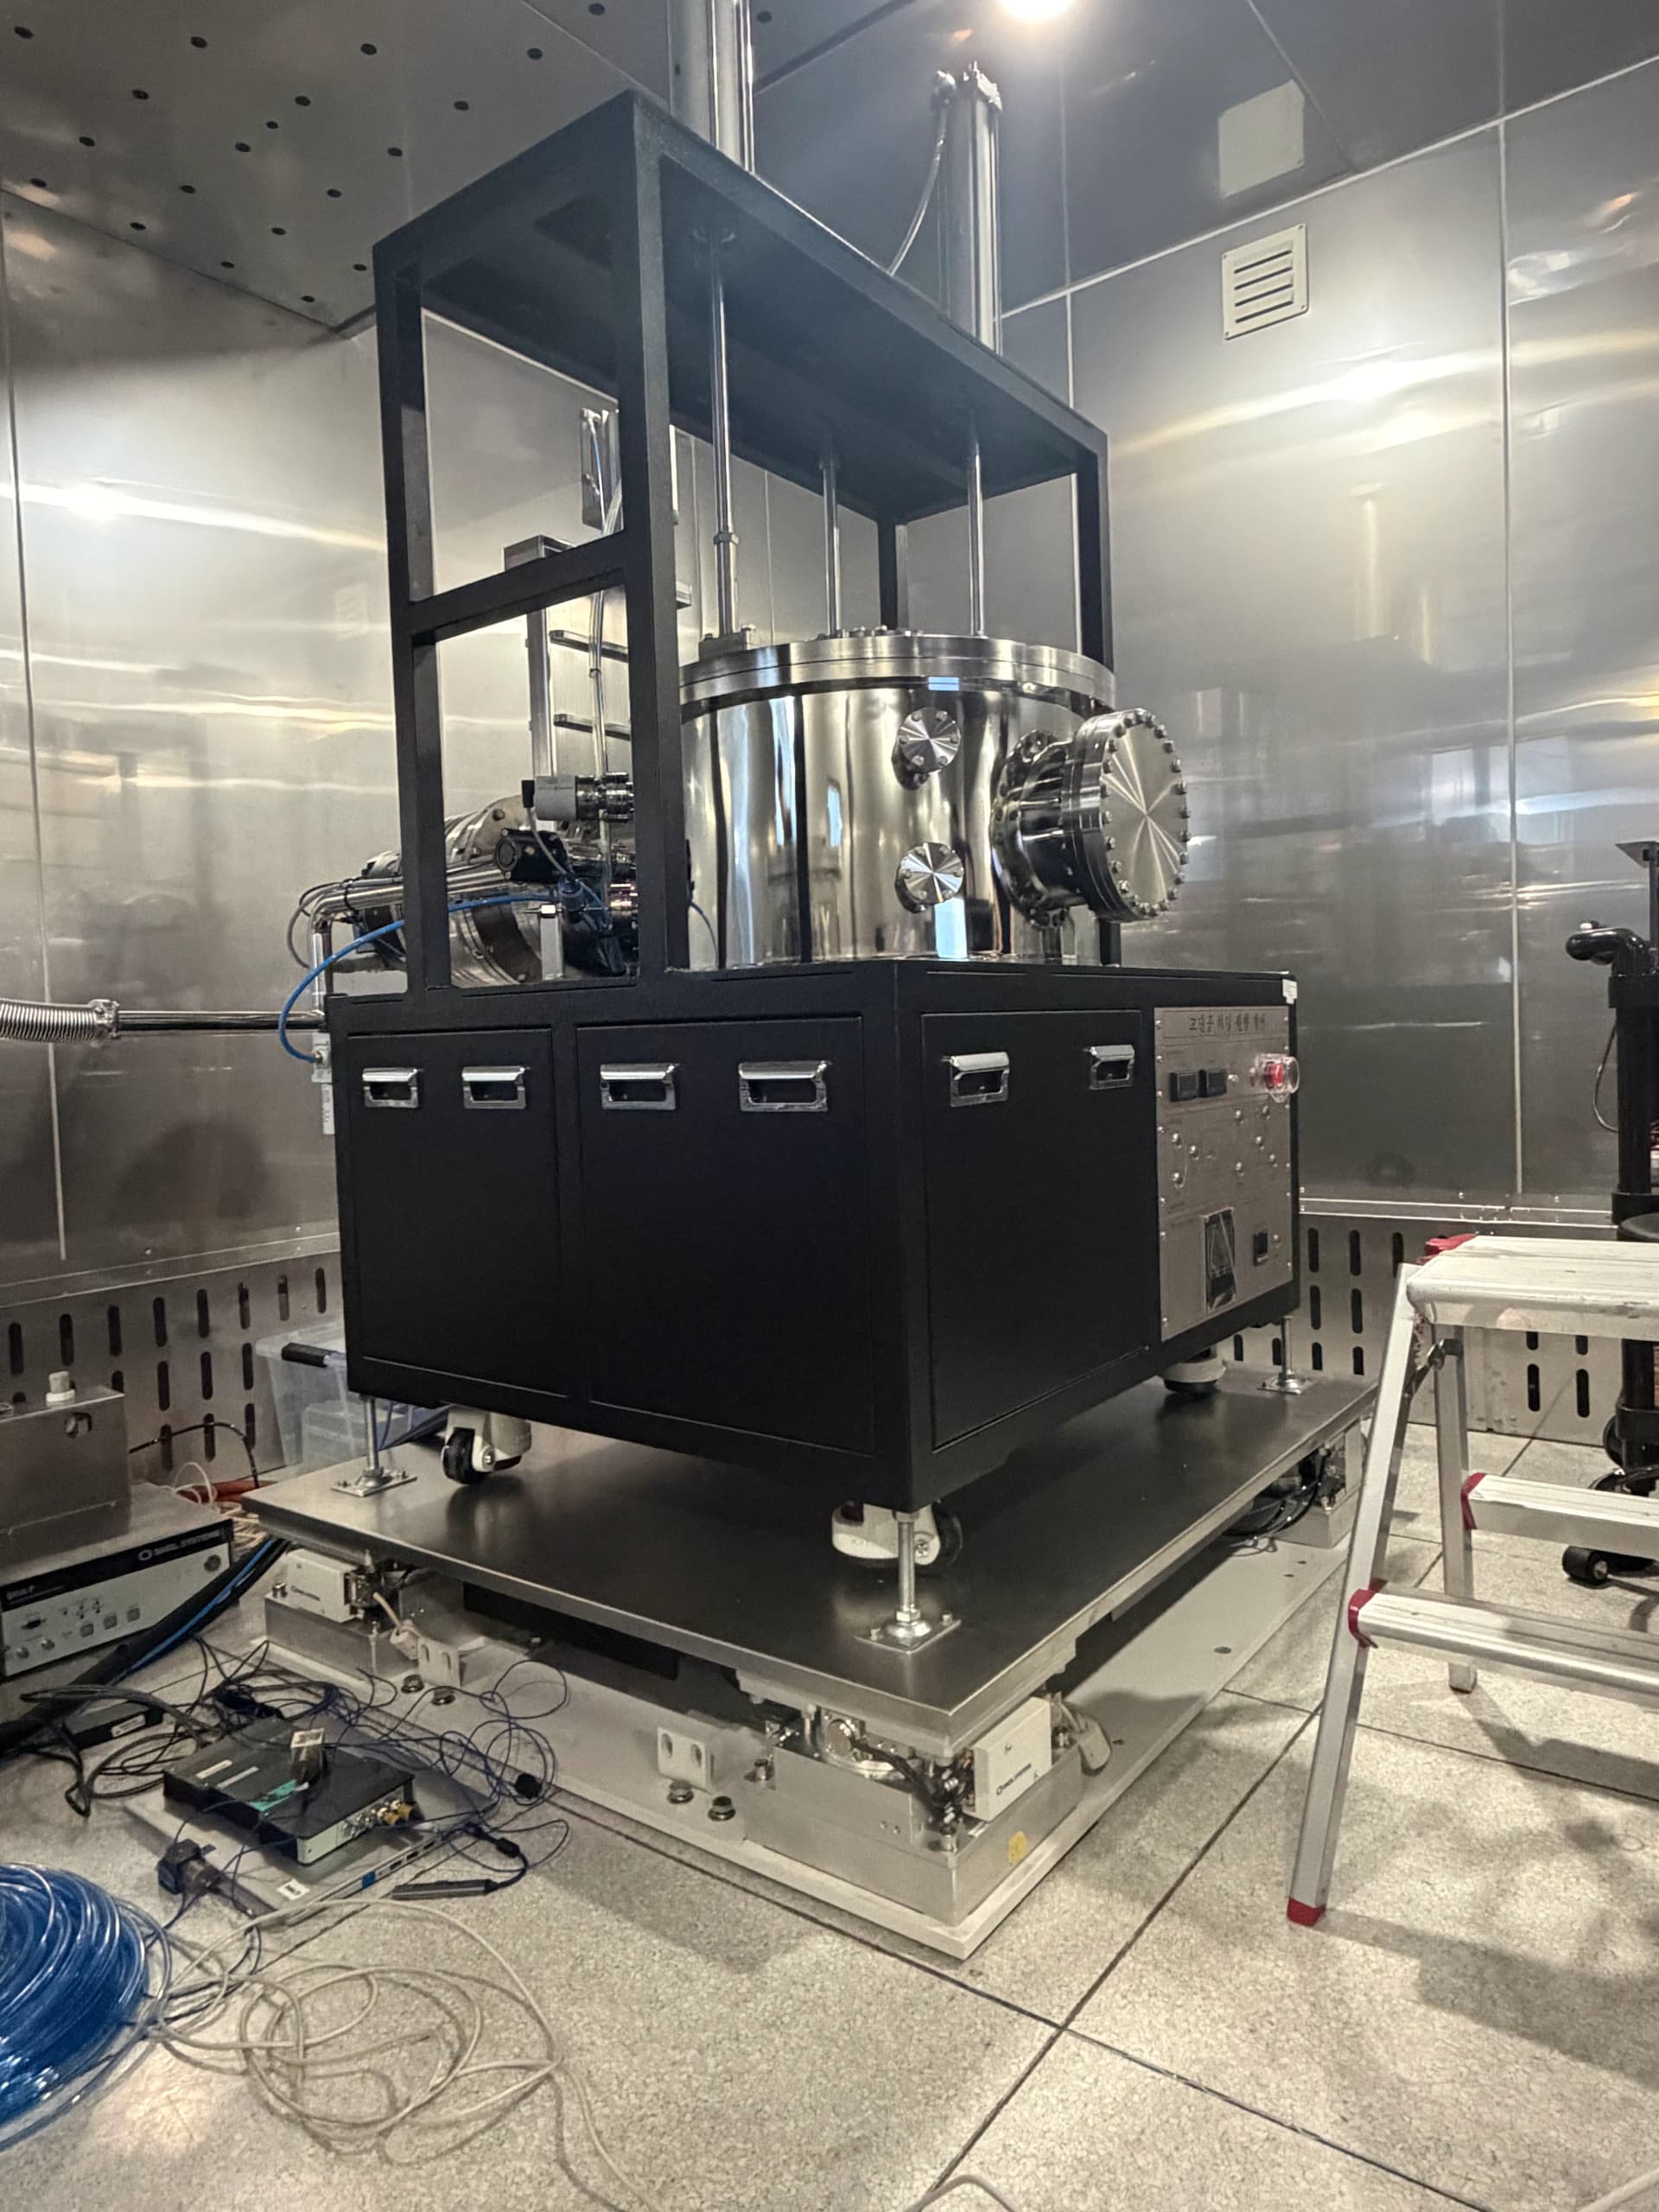
The DVIA-P2200 was installed in the laboratory on the 1st floor of Building L2 at the Korea Institute of Machinery & Materials (KIMM), and tuning and vibration measurement were performed.
The inspection and vibration measurement were conducted with the equipment Turned off.
The measured data are presented as VC Curves, and reference vibration-level criteria are provided.
Vibration Isolation System Information
Model: DVIA-P2200
Serial Number: 250122R1-1
Engineer
Seongyun Jeong, Gyumin Park, DAEIL SYSTEMS
Tuning Date
September 22, 2026
Installation Site
Laboratory on the 1st Floor, Building L2, Korea Institute of Machinery & Materials (KIMM)
End User
Korea Institute of Machinery & Materials (KIMM)
Customer Equipment
Manufacturer: EL
Equipment: High Vacuum Chamber
Model: N/A
Vibration Specification
N/A
Equipment Status
Turn off
Measuring Equipment
Measurement Equipment
Hardware: B&K Front End Type 3040-A-040
Software: B&K Pulse Labshop22 Version
Accelerometer
PCB 393B05
Measuring Set-up
F Span: 200 Hz
Lines: 2400
Engineering Units: m/s
Window: Hanning
Averaging: FFT Spectrum Averaging
Conclusion
Tuning and vibration measurement were performed for the DVIA-P2200 (S/N: 250122R1-1) vibration isolation system for the high vacuum chamber (Manufacturer: EL) installed in the laboratory on the 1st floor of Building L2 at the Korea Institute of Machinery & Materials (KIMM).
Piping improvement and control stabilization: In similar cases, when multiple air pipes were bundled together, a pressure difference on one side caused exhaust (OUT) to become unstable, which had interfered with normal position (POS) control. To prevent this issue in advance, the air pipes were reconnected as separate independent lines, establishing a stable air-pressure supply and a precise control environment.
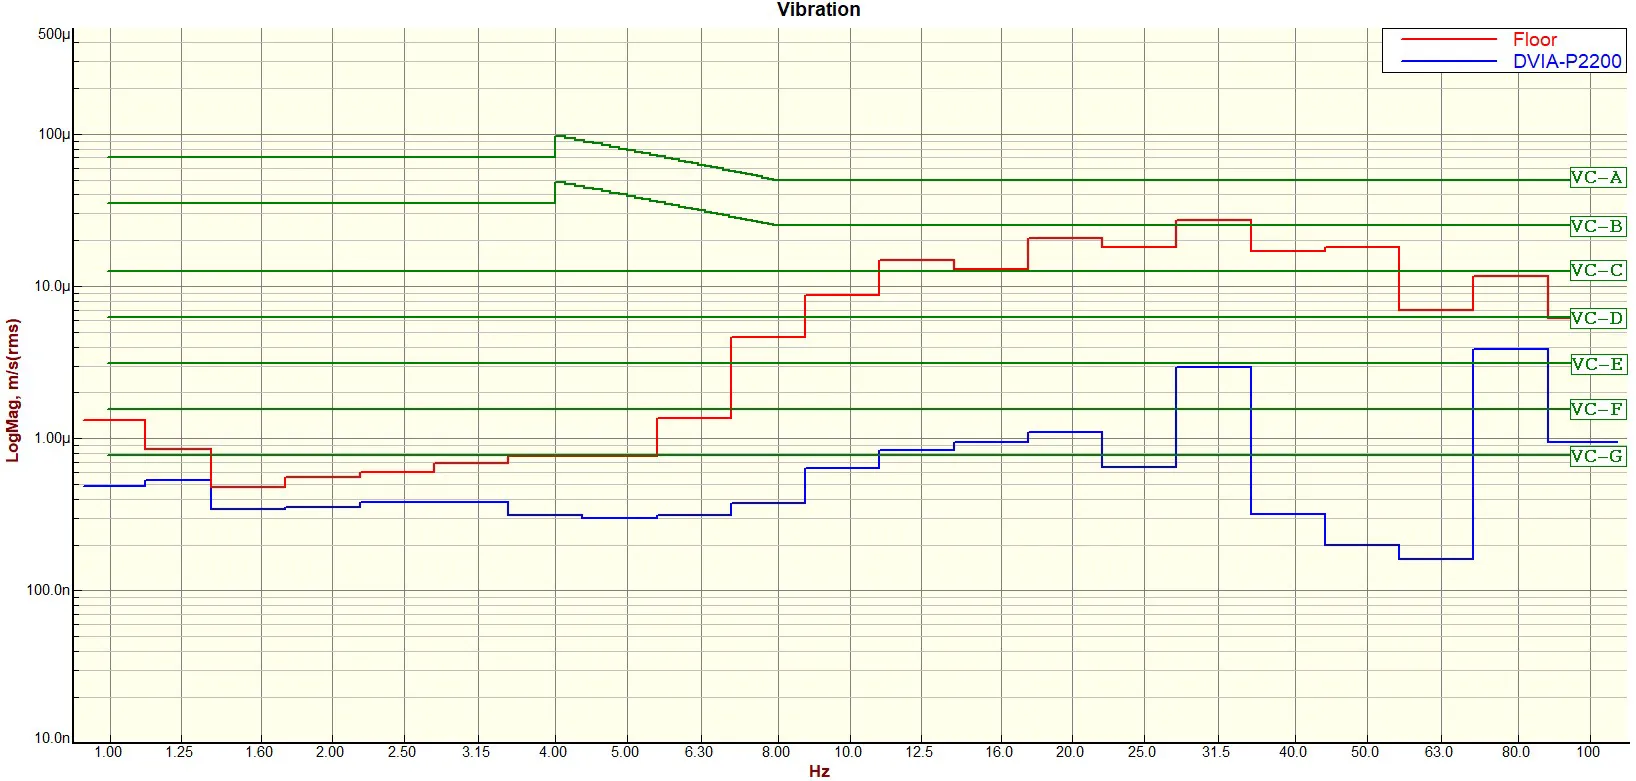
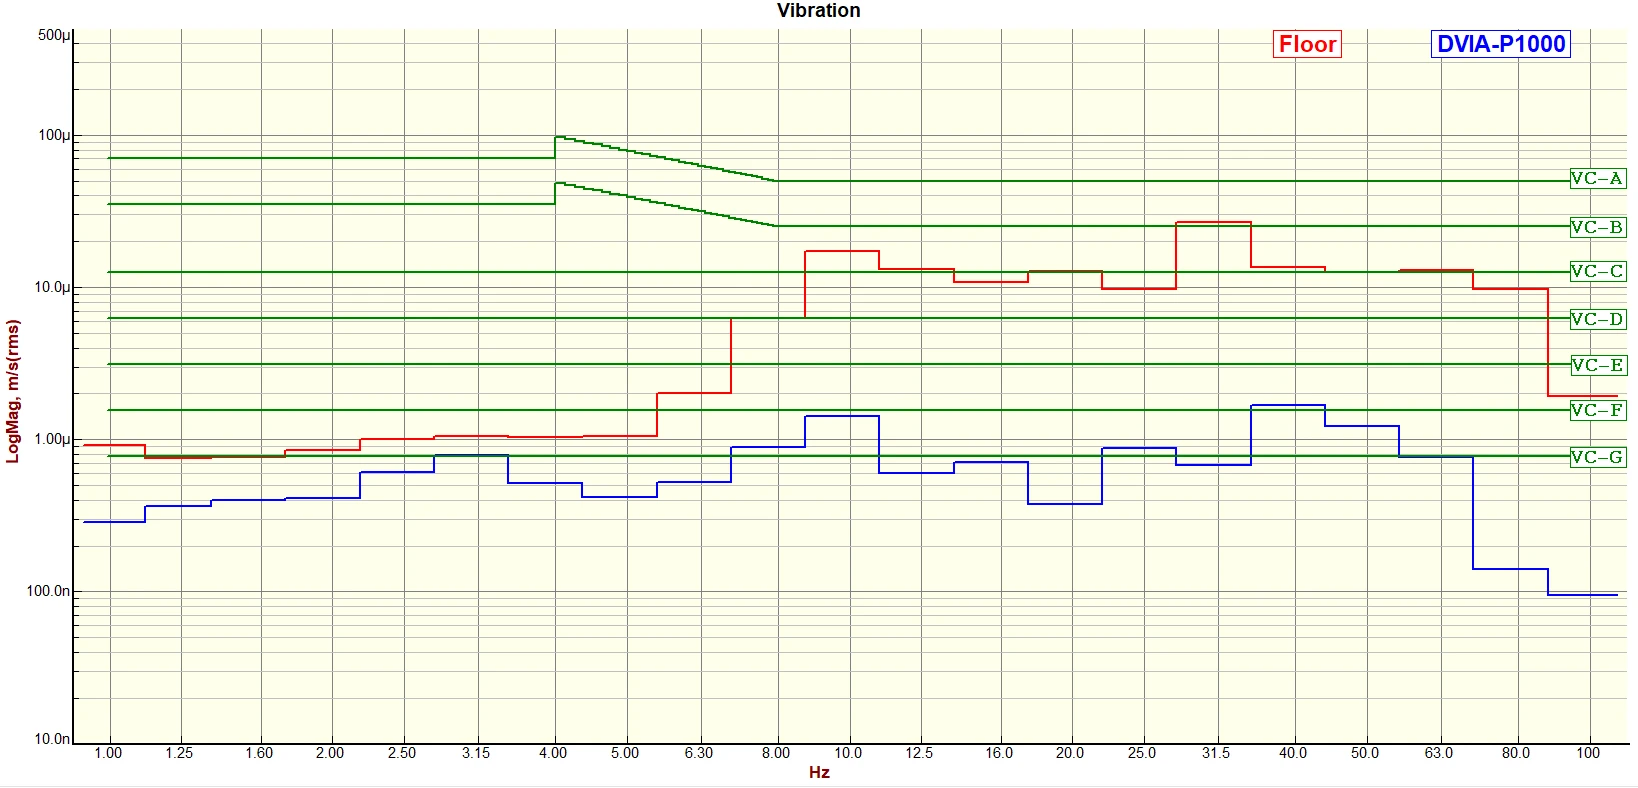
Vibration measurement results: In the Turn-off state, the floor vibration and the vibration level after the isolation system (DVIA-P2200) was operated were measured axis by axis and compared as VC Curves. Excellent vibration isolation performance was confirmed on all axes (vertical / left-right / front-back).
Measurement Summary
| Measurement Point | Vibration Specification | Measured Axis | Measured Result | ||
|---|---|---|---|---|---|
| Floor | DVIA-P2200 | ||||
| 1. Floor 2. DVIA-P2200 | N/A | Vertical (Z-axis) | VC-B | VC-E | |
| Left to Right (X-axis) | VC-D | VC-E | |||
| Front to Back (Y-axis) | VC-E | VC-E | |||
Data and Image
Vertical (Z-axis)
Z-axis — Autospectrum
Z-axis — VC Curves
Left to Right (X-axis)
X-axis — Autospectrum
X-axis — VC Curves
Front to Back (Y-axis)
Y-axis — Autospectrum
Y-axis — VC Curves
Installation Photo
Reference
Notes:
1. VC-A/B is measured in 1/3 octave bands from 8-80 Hz, VC-C through VC-G from 1-80 Hz.
2. Detail size refers to line widths in microelectronics manufacturing or particle sizes in medical research.