QRT DVIA-T67 DEMO (241213R2) Inspection Report — MSTech MST8500 Probe Station
Contents
Customer
QRT
Author
Engineers: Chaewon Lee, Jonghwa Seo
Installation Date
24.12.20
Report Written Date
24.12.26
Overview
Tuning and vibration measurement were conducted for DEMO equipment DVIA-T67 shipped to the 3rd floor QRT laboratory at Korea Institute of Nano Technology.
After equipment was set in place, vibration measurement and tuning were performed with the equipment Turned off.
During vibration measurement after tuning, personnel were walking nearby; this may affect the measurement results.
Data are presented as VC curves, and Reference materials are provided for vibration levels.
Vibration Isolation Platform
Model: DVIA-T67
Serial Number: 241213R2
Engineer
DAEIL SYSTEMS field engineers Chaewon Lee, Jonghwa Seo
Tuning Date
December 20, 2024
Installation Site
Korea Institute of Nano Technology 3F QRT
Equipment Status
Equipment installed and Turned off
Customer Equipment
Manufacturer: MSTech
Equipment: Probe Station
Model: MST8500
Measuring Equipment
8.1) Brüel & Kjær LAN-XI DAQ Type 3050 DAQ
Hardware: B&K Front End Type 3050-A-040
Software: B&K Pulse Labshop 22 Version
8.2) Accelerometer
PCB Accelerometer
Model: 393B05
Vibration Measurement Setup
Bandwidth: 200 Hz
Lines: 3200
Engineering Units: m/s
Averaging: Spectrum Averaging
Window: Hanning
Overlap: Max
Conclusion
DVIA-T67 & Table
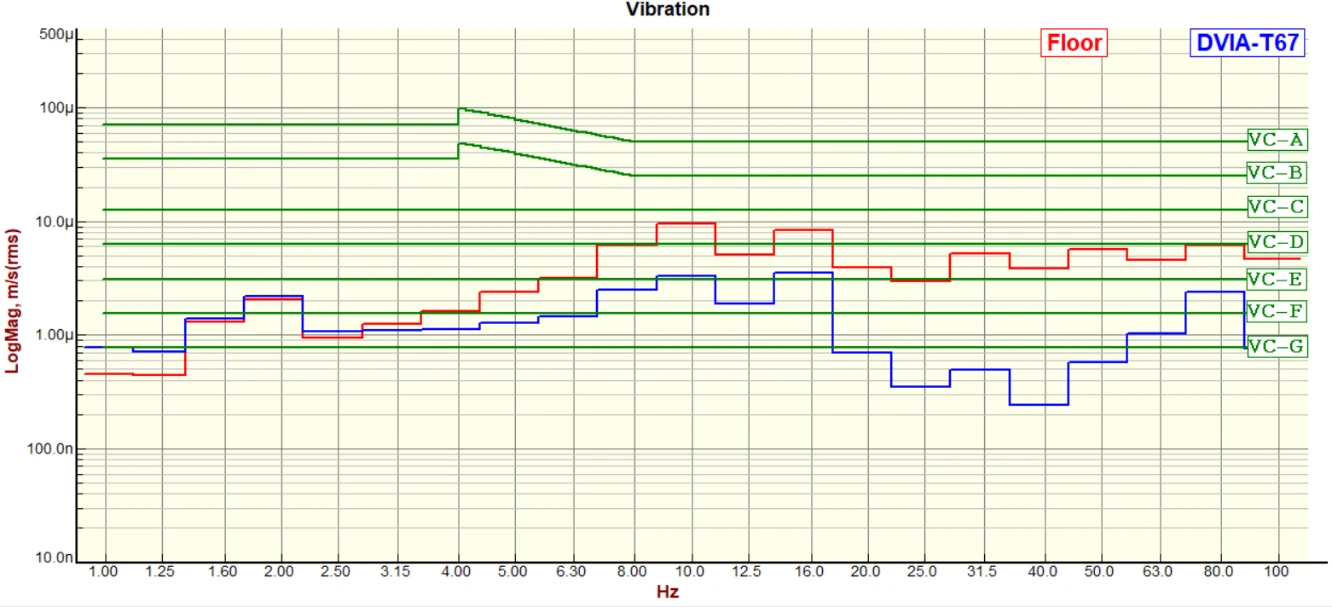
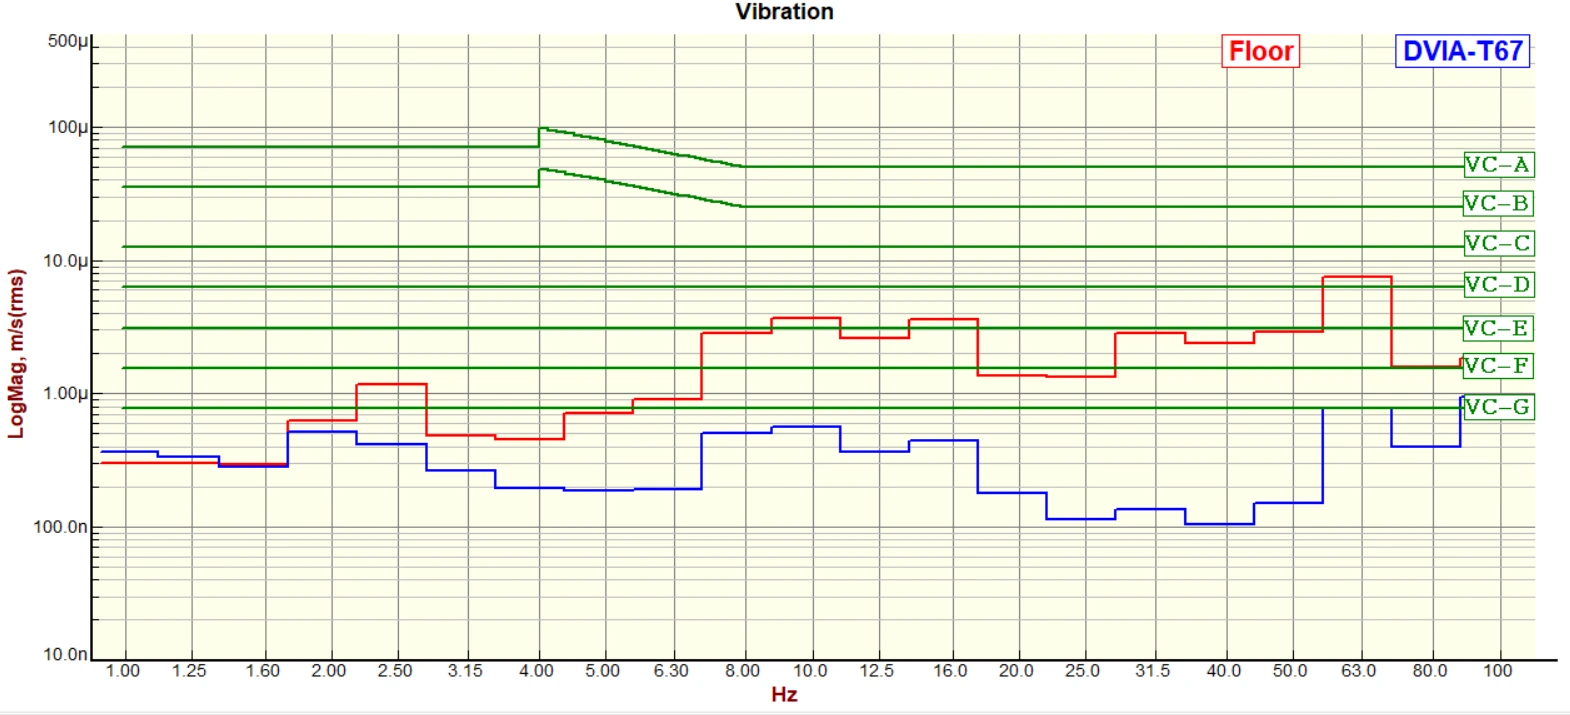
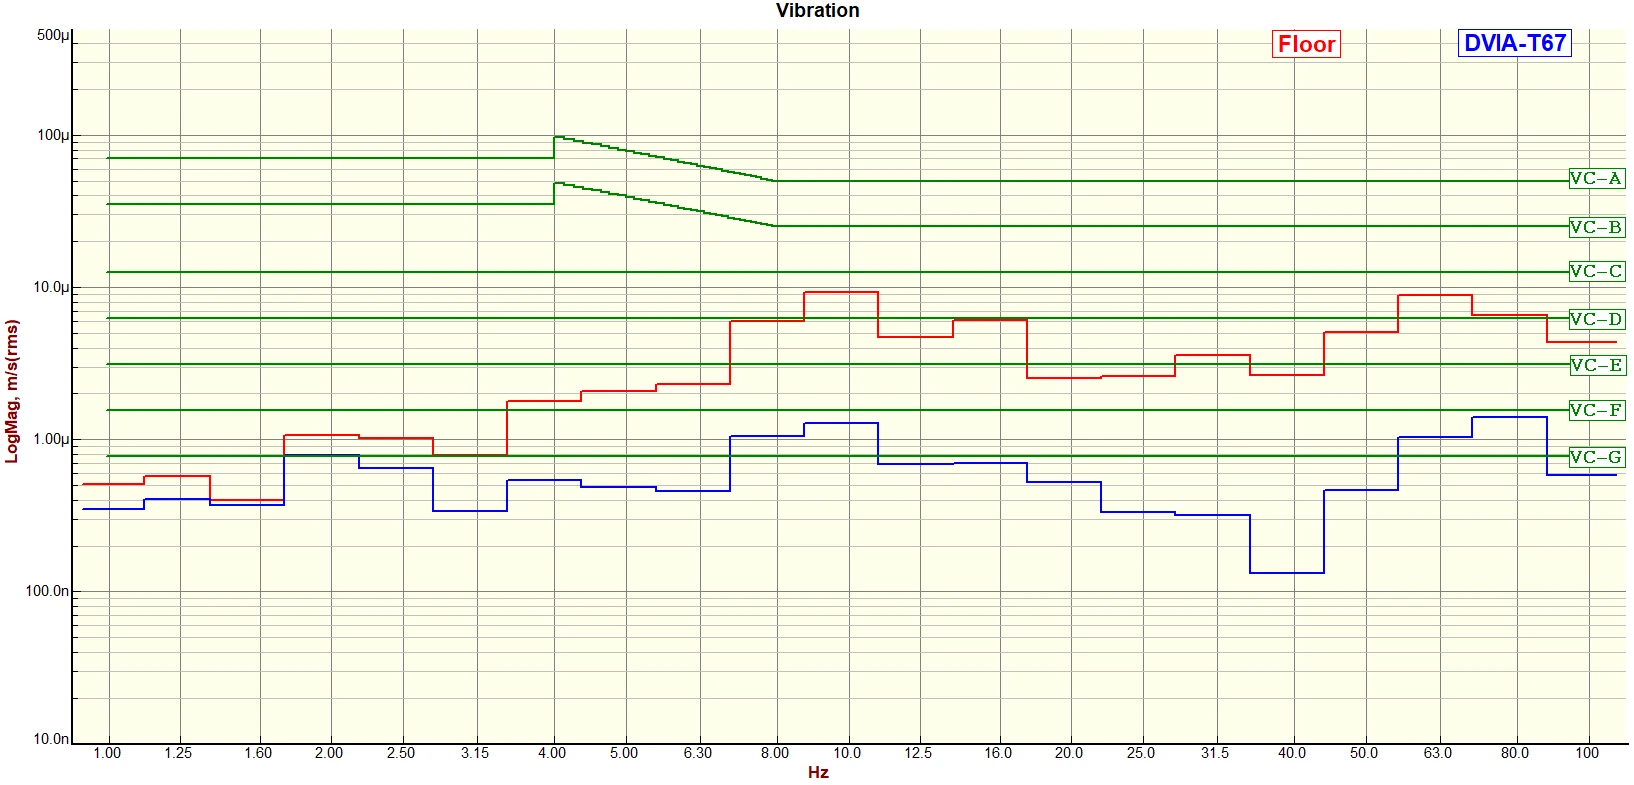
Vertical: At 16 Hz, vibration at VC-C attenuates to VC-G.
Left to Right: At 16 Hz, vibration at VC-B attenuates to VC-F.
Front to Back: At 1 Hz, vibration at VC-B attenuates to VC-D.
Measurement Data
| Place of Measurement | Status | Direction | Table | DVIA-T67 |
|---|---|---|---|---|
| Korea Institute of Nano Technology 3F QRT laboratory 1. Table 2. DVIA-T67 | 장비설치/IDLE | Vertical | VC-B @ 1 Hz | VC-D @ 1 Hz |
| Left to Right | VC-B @ 16 Hz | VC-F @ 16 Hz | ||
| Front to Back | VC-B @ 1 Hz | VC-D @ 1 Hz |
Data and Image
1) DVIA-T67 & Table
Vertical VC Curves
Vertical Autospectrum
Vertical Transmissibility
Left to Right VC Curves
Left to Right Autospectrum
Left to Right Transmissibility
Front to Back VC Curves
Front to Back Autospectrum
Front to Back Transmissibility
Equipment Photo
Reference
Notes:
1. VC-A/B is measured in 1/3 octave bands from 8-80 Hz, VC-C through VC-G from 1-80 Hz.
2. Detail size refers to line widths in microelectronics manufacturing or particle sizes in medical research.
Share this Case Study
Case Study Information
Related Case Studies
QRT DVIA-T67 DEMO (241213R2) Installation Report — MSTech MST8500 Probe Station
QRT MST8500 Probe Station DVIA-T67 (250204R2) Installation Report