AIPIN STM DVIA-ML1000 Re-Tuning Installation Report
Contents
Overview
Re-tuning of the DVIA-M1000 (S/N 221024R3) at the National Center for Nanoscience and Technology in Beijing was performed in response to isolator instability reported by the customer, followed by vibration measurement. Vibration was measured on the floor and on the isolator with the AIPIN STM in the IDLE state. Results are presented as Autospectrum and VC Curves for each axis, together with a reference table of vibration criteria.
Vibration Isolation System Information
Model: DVIA-ML1000
Serial Number: 221024R3
Engineer
Taehun Kim · DAEIL SYSTEMS
Tuning Date
2026.10.13
End User
National Center for Nanoscience and Technology
Number of Tuning Trial
5th (re-tuning)
Site
Beijing
Equipment
Manufacturer: Aipin Instrument Technology
Equipment: STM
Model: AIPIN STM
Vibration Specification
No vibration specification for the mounted equipment was available from the manufacturer or the end user at the time of measurement. This report therefore presents measured vibration levels only and makes no PASS/FAIL determination.
Equipment Condition
The mounted UHV STM system is mechanically connected to off-isolator structures (floor-standing frame, transfer rods, hoses and cables); the isolator was therefore not in a fully isolated condition during measurement.
Tuning Request
Conclusion
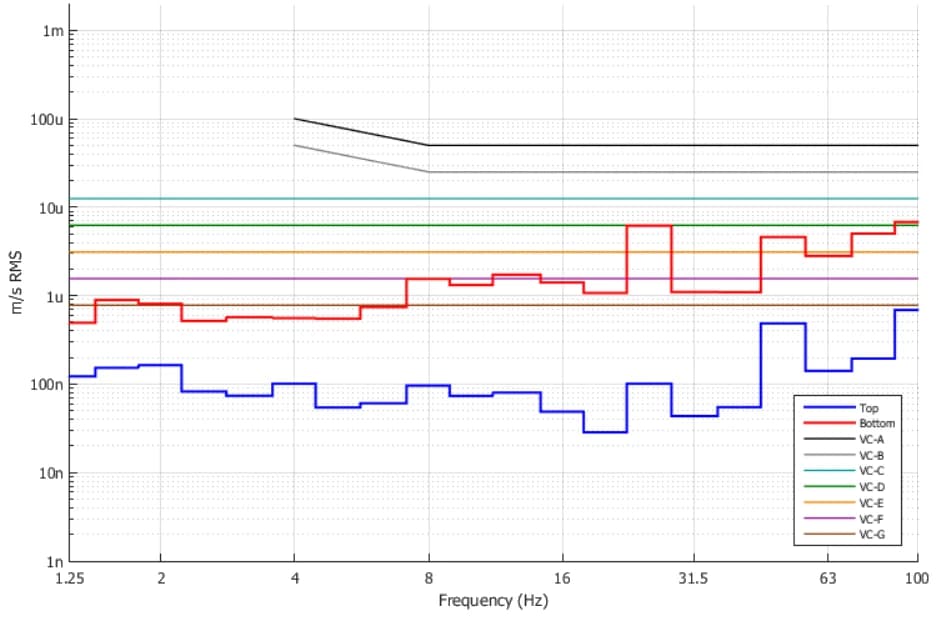
Floor vibration was attenuated on all axes except the 12–16 Hz band on the horizontal axes, where the isolator level exceeded the floor. The isolator reached VC-G (Vertical) and VC-E (Left to Right, Front to Back).
This horizontal amplification is attributed to mechanical connections between the mounted system and surrounding structures, which bypass the isolator (Section 10).
As no vibration specification was provided (Section 9), final assessment rests with the equipment manufacturer or the end user.
Measurement Summary
| Measurement Point | Axis | Floor | DVIA-ML1000 | ||
|---|---|---|---|---|---|
| 1. Floor<br>2. DVIA-ML1000 | Vertical | VC-C | VC-G | ||
| Left to Right | VC-D | VC-E | |||
| Front to Back | VC-D | VC-E | |||
Measurement Data Obtained via UI Program
Vertical
Vertical — Autospectrum
Vertical — VC Curves
Left to Right
Left to Right — Autospectrum
Left to Right — VC Curves
Front to Back
Front to Back — Autospectrum
Front to Back — VC Curves
Installation Photo
Equipment
Reference
The table below classifies vibration levels based on IEST-RP-CC012.2.
¹ As measured in one-third octave bands of frequency over the frequency 8 to 80 Hz (VC-A and VC-B) or 1 to 80 Hz (VC-C through VC-G).
² The detail size refers to the width in the case of microelectronics fabrication, the particle (cell) size in the case of medical and pharmaceutical research, etc. It is not relevant to imaging associated with probe technologies, AFMs, and nanotechnology.
The information given in this table is for guidance only. In most instances, it is recommended that the advice of someone knowledgeable about applications and vibration requirements of the equipment and processes be sought.
Share this Case Study
Case Study Information
Related Case Studies
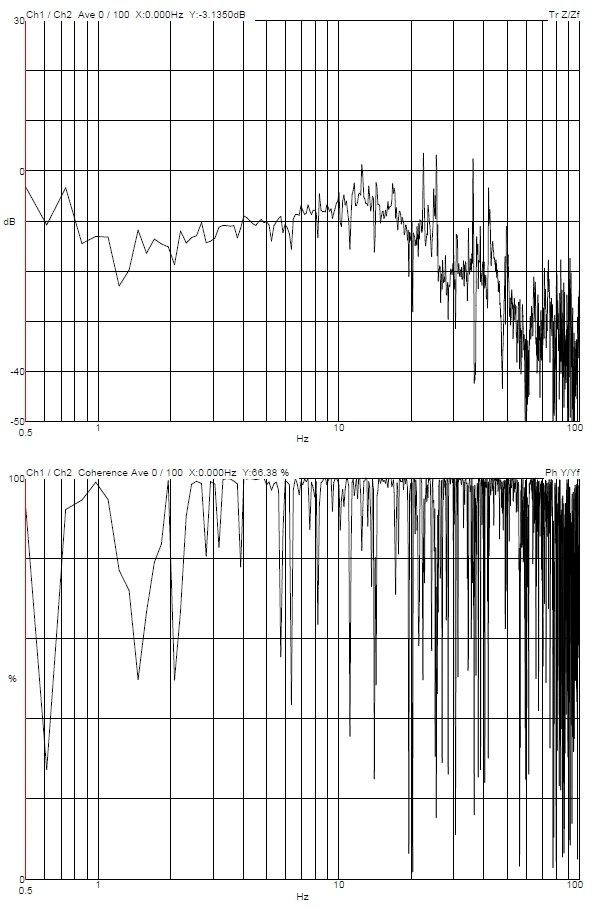
National Center for Nanoscience and Technology DVIA-MO1000 (221024R3) Internal Program Performance — 2025.03.05
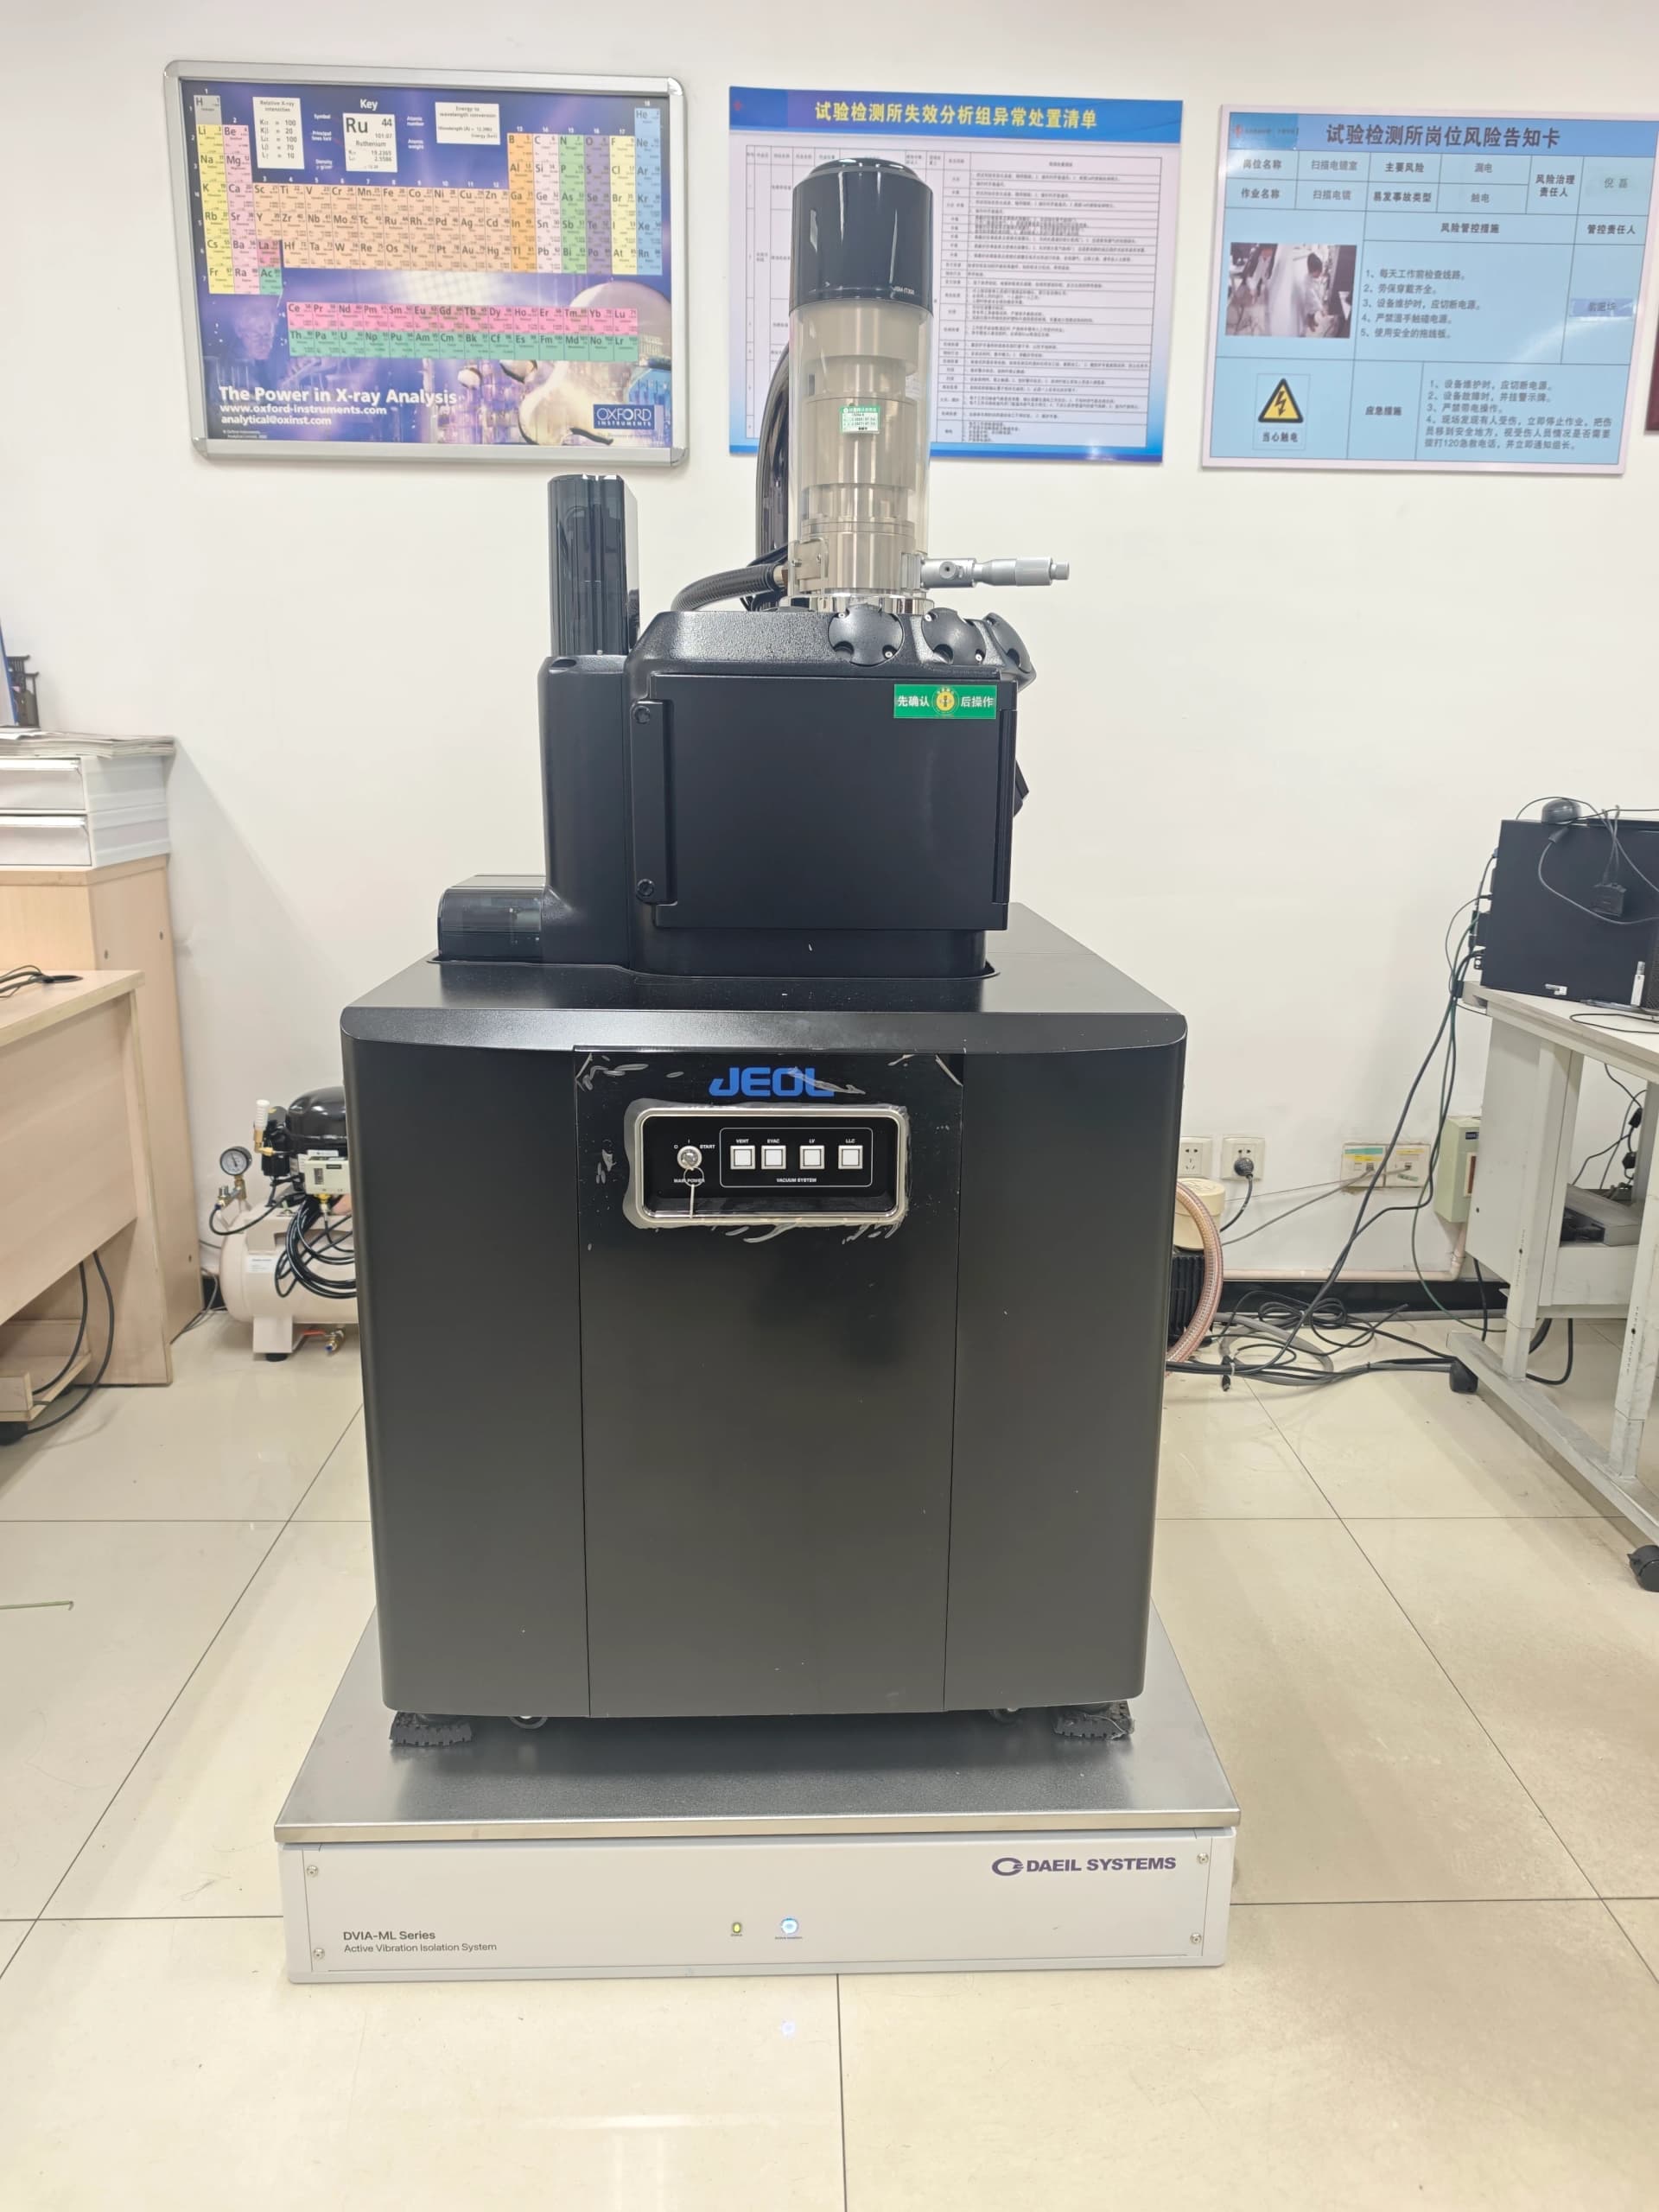
JEOL JSM-IT300 SEM DVIA-ML1000 Installation Report