KimTechnix Keyence VK-X4000 Laser Scanning Confocal Microscope DVIA-TD45 (260616R5) Installation Report
Contents
Overview
This report describes the tuning and vibration measurement results for the DVIA-TD45 installed in the KimTechnix laboratory.
The measurements were carried out under three conditions: desk vibration before the isolation platform was applied, the passive isolation state, and the active isolation state, in order to compare and analyze the vibration reduction effect of the isolation platform. The equipment on top, the Keyence VK-X4000, was inspected and measured in the Idle state.
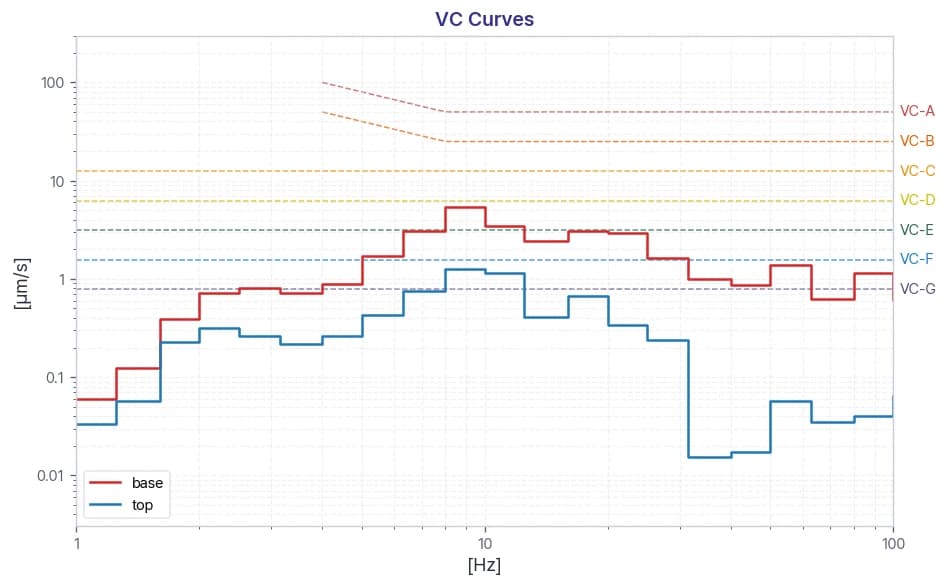
The measurement data are presented as Autospectrum and VC Curve plots, together with the IEST-RP-CC012.2 classification criteria (Section 13) as reference material for the current vibration level.
Vibration Isolation System Information
Model: DVIA-TD45
Serial Number: 260616R5
Engineer
Taehun Kim · DAEIL SYSTEMS
Tuning Date
2026.09.08
Site
KimTechnix Laboratory
End User
KimTechnix
Customer Equipment
Manufacturer: Keyence
Equipment: VK-X4000
Model: Laser Scanning Confocal Microscope
Equipment Condition
Idle
Vibration Measurement Equipment
Measurement Equipment
Hardware: Bruel & Kjaer Type 3050-A-040
Software: Pulse 22
Accelerometer
PCB 393B05 2EA (Top, Base)
Vibration Measurement Setup
F Span: 200 Hz
Lines: 2400
Engineering Units: m/s
Window: Hanning
Averaging: FFT Spectrum Averaging
Conclusion
To quantitatively confirm the vibration reduction effect of the DVIA-TD45, the measurements were carried out under three conditions: ① desk vibration without the isolation platform applied, ② the passive isolation state with that vibration as input, and ③ the active isolation state. The measurement data for each condition were compared and analyzed as Autospectrum and VC Curve plots.
As a result of the measurements, the main resonance component (approximately 12 Hz) observed on the desk top plate without the isolation platform was first reduced in the passive isolation state, and was further suppressed once active isolation was activated, securing a stable vibration level across the entire frequency band. In particular, the effect of active isolation was clearly confirmed in the low-frequency range (below 10 Hz), where passive isolation alone provided limited reduction.
The final vibration level was measured within the VC-F grade in all directions: vertical (Z-axis), left-to-right (X-axis), and front-to-back (Y-axis). Under the IEST-RP-CC012.2 classification, VC-F and VC-G are ranges for which no specific equipment class is designated, and they correspond to vibration levels lower than VC-E (3.12 μm/s), the lowest criterion for which an equipment class is defined. Compared with the VC-C (12.5 μm/s) and VC-D (6.25 μm/s) criteria, which include high-magnification optical microscopes and electron-microscope-class equipment, a sufficient margin has been secured.
Also, since the resonance components observed without the isolation platform were effectively suppressed once active isolation was activated, no vibration-derived limiting factors were observed for the operation of the Keyence VK-X4000 in its current installed state.
However, this assessment is based on the classification criteria and the environmental conditions at the time of measurement. If the equipment manufacturer provides a separate installation vibration requirement, a comparative review against that criterion is needed.
In addition, the vibration level may change if the equipment Operating conditions or the installation environment (addition of adjacent equipment, changes to HVAC/utilities, etc.) changes, so remeasurement is recommended when the environment changes.
Measurement Data
Passive
Vertical (Z-axis)
Z-axis — Autospectrum
Z-axis — VC Curves
Left to Right (X-axis)
X-axis — Autospectrum
X-axis — VC Curves
Front to Back (Y-axis)
Y-axis — Autospectrum
Y-axis — VC Curves
Active
Vertical (Z-axis)
Z-axis — Autospectrum
Z-axis — VC Curves
Left to Right (X-axis)
X-axis — Autospectrum
X-axis — VC Curves
Front to Back (Y-axis)
Y-axis — Autospectrum
Y-axis — VC Curves
Installation Photos
Reference
The table below classifies vibration levels based on IEST-RP-CC012.2.
¹ As measured in one-third octave bands of frequency over the frequency 8 to 80 Hz (VC-A and VC-B) or 1 to 80 Hz (VC-C through VC-G).
² The detail size refers to the width in the case of microelectronics fabrication, the particle (cell) size in the case of medical and pharmaceutical research, etc. It is to imaging associated with probe technologies, AFMs, and nanotechnology.
The information given in this table is for guidance only. In most instances, it is recommended that the advice of someone knowledgeable about applications and vibration requirements of the equipment and processes be sought.
Share this Case Study
Case Study Information
Related Case Studies
Hyundai Motor Keyence Laser Confocal Microscope VK-3000 DVIA-TD45 Installation Report
Pharrics BV MPI Corporation Probe Station MPI TS150 DVIA-T67 (260402R1) Installation Report
