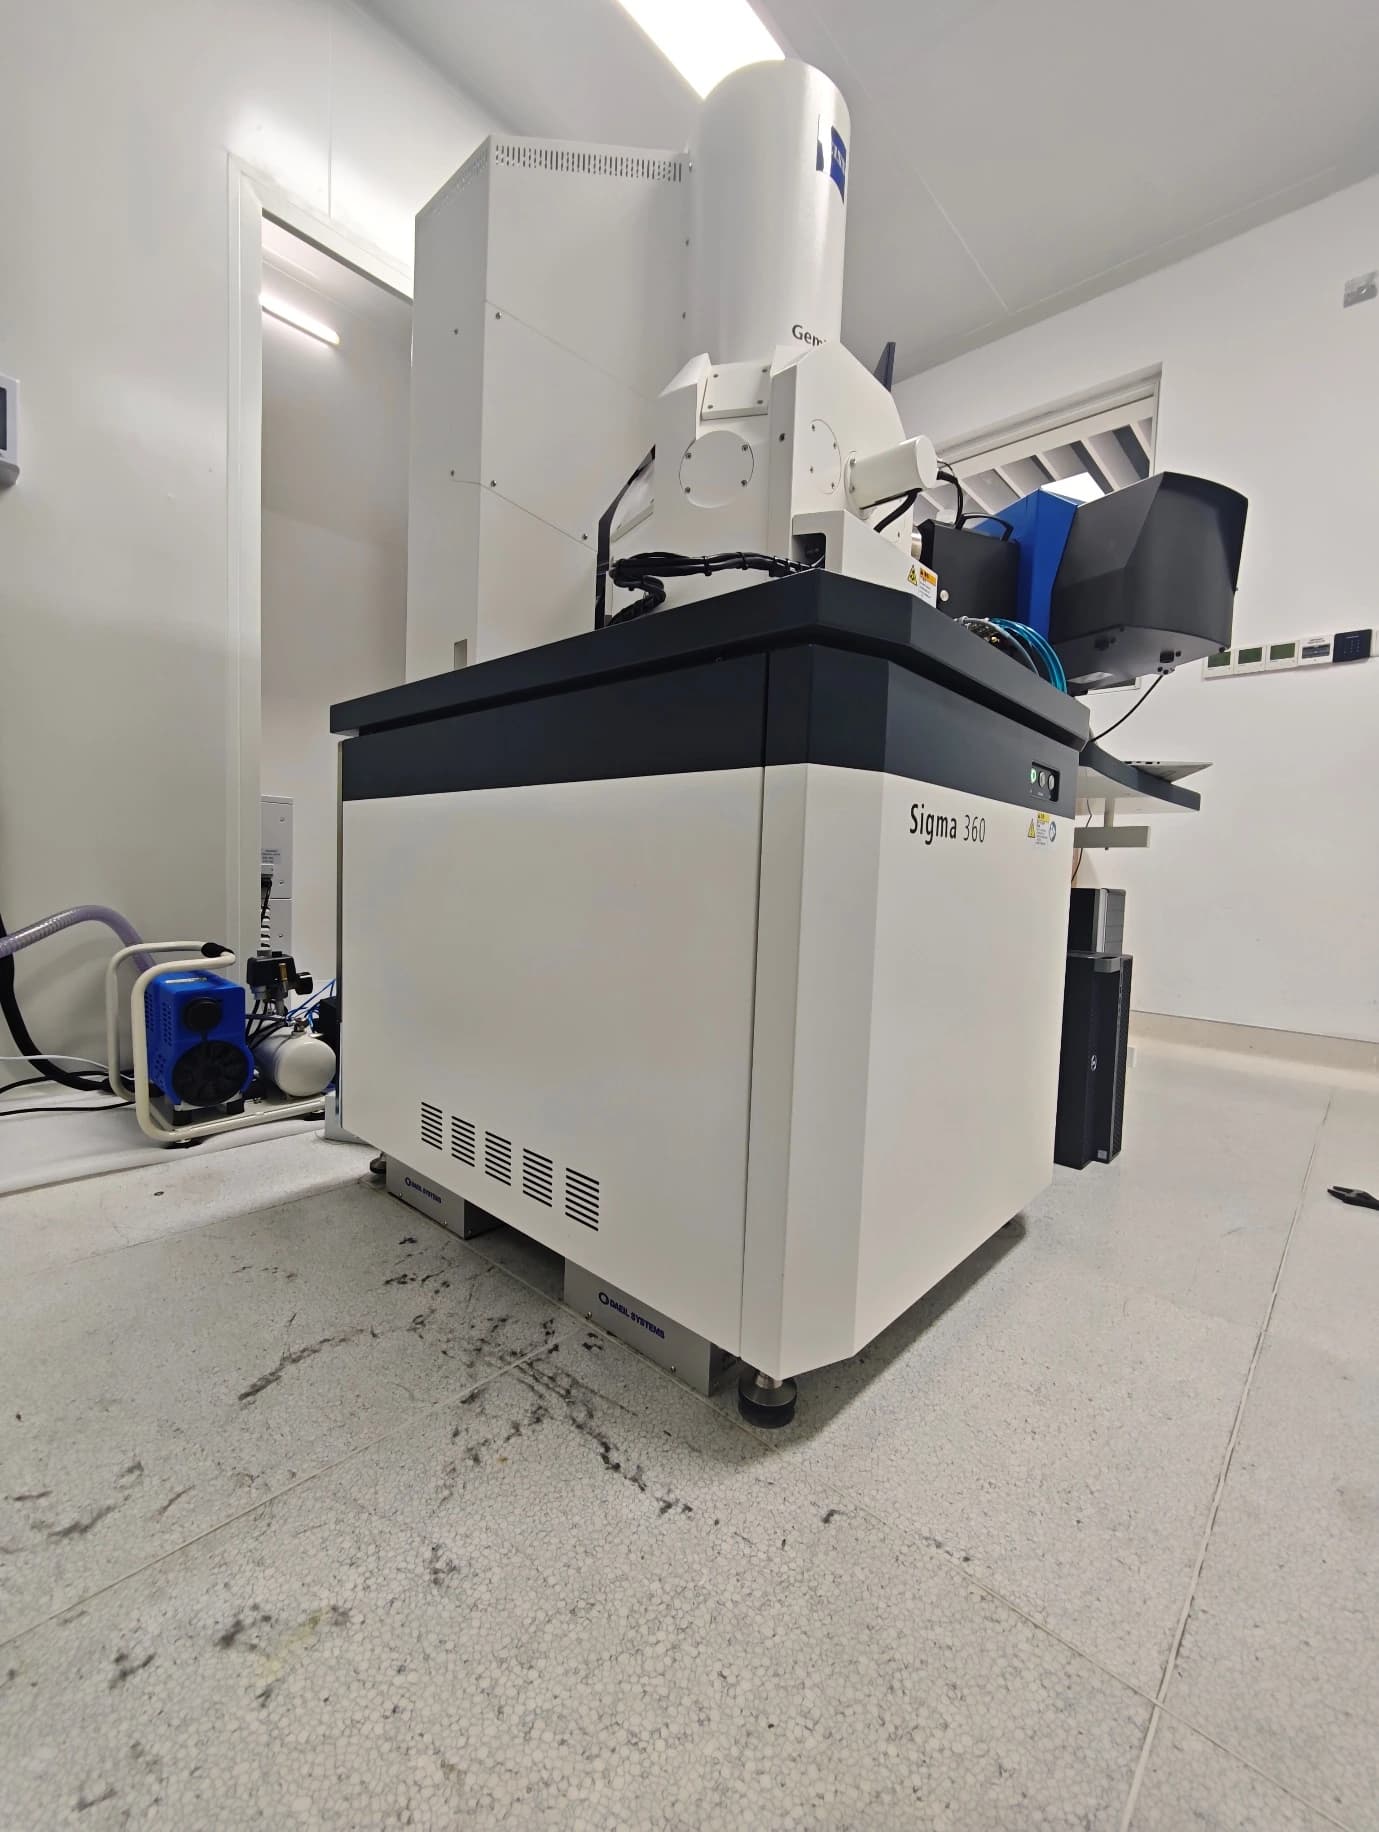
ZEISS FE-SEM Sigma 360 DVIA-ULF700 Installation Report
Contents
Overview
Following the installation of the DVIA-ULF700 in Hubei, tuning and vibration measurement were performed. This was the 2nd tuning, carried out at the customer's request after the initial tuning on 2026.09.08. Vibration measurement was conducted with the equipment in the Idle state. Measurement data is presented as autospectrum plots for each axis (Vertical, Left to Right, Front to Back), and reference material on vibration levels is provided in Section 16.
Vibration Isolation System Information
Model: DVIA-ULF700
Serial Number: 260605R7
Engineer
Taehun Kim · DAEIL SYSTEMS
Tuning Date
2026.09.21
End User
Hubei Jinquan
Number of Tuning Trial
2nd
Site
Hubei
Equipment
Manufacturer: ZEISS
Equipment: FE-SEM
Model: Sigma 360
Vibration Specification
Horizontal
| Frequency [Hz] | Allowable [mm/s² RMS] |
|---|---|
| 1 | 0.04 |
| 10 | 0.04 |
| 10 | 0.17 |
| 20 | 0.17 |
| 20 | 0.3 |
| 70 | 0.3 |
| 70 | 2 |
| 100 | 2 |
Vertical
| Frequency [Hz] | Allowable [mm/s² RMS] |
|---|---|
| 1 | 0.03 |
| 8 | 0.03 |
| 8 | 0.15 |
| 45 | 0.15 |
| 45 | 2 |
| 100 | 2 |
Equipment Condition
Idle
Tuning Request
Conclusion
During the initial tuning on 2026.09.08, the system did not achieve satisfactory isolation performance. At the customer's request, a 2nd tuning was performed on 2026.09.21, and the vibration levels on the DVIA-ULF700 met the specification on all three axes (Vertical, Left to Right, Front to Back). The floor vibration exceeded the specification on all axes.
A photo comparison of the two tuning sessions indicates that the passive setup was readjusted. In particular, the spring compression appears more evenly distributed across the four support points. This suggests the load was shared more uniformly between the supports.
Because spring stiffness varies with compression, the stiffness at all four support points must be balanced appropriately. The previous setup likely did not achieve this. The improved passive setup is therefore presumed to have reduced interference with the active control band, which improved overall isolation performance.
To maintain this performance, it is recommended that the current passive setup, including spring compression and load distribution, be preserved. It should be rechecked if the equipment is relocated or its payload changes.
Measurement Summary
| Measurement Point | VibrationSpecifications | Axis | Result | |
|---|---|---|---|---|
| Floor | DVIA-ULF700 | |||
| 1. Floor 2. DVIA-ULF700 | See Section 9 | Vertical | ✗ FAIL | ✓ PASS |
| Left to Right | ✗ FAIL | ✓ PASS | ||
| Front to Back | ✗ FAIL | ✓ PASS | ||
Measurement Data Obtained via UI Program
Vertical
Vertical — Autospectrum
Left to Right
Left to Right — Autospectrum
Front to Back
Front to Back — Autospectrum
Installation Photo
Equipment
Passive 1
Passive 2
Passive 3
Passive 4
Reference
The table below classifies vibration levels based on IEST-RP-CC012.2.
Notes:
1. As measured in one-third octave bands of frequency over the frequency 8 to 80 Hz (VC-A and VC-B) or 1 to 80 Hz (VC-C through VC-G).
2. The detail size refers to the width in the case of microelectronics fabrication, the particle (cell) size in the case of medical and pharmaceutical research, etc. It is to imaging associated with probe technologies, AFMs, and nanotechnology.
The information given in this table is for guidance only. In most instances, it is recommended that the advice of someone knowledgeable about applications and vibration requirements of the equipment and processes be sought.
Share this Case Study
Case Study Information
Related Case Studies
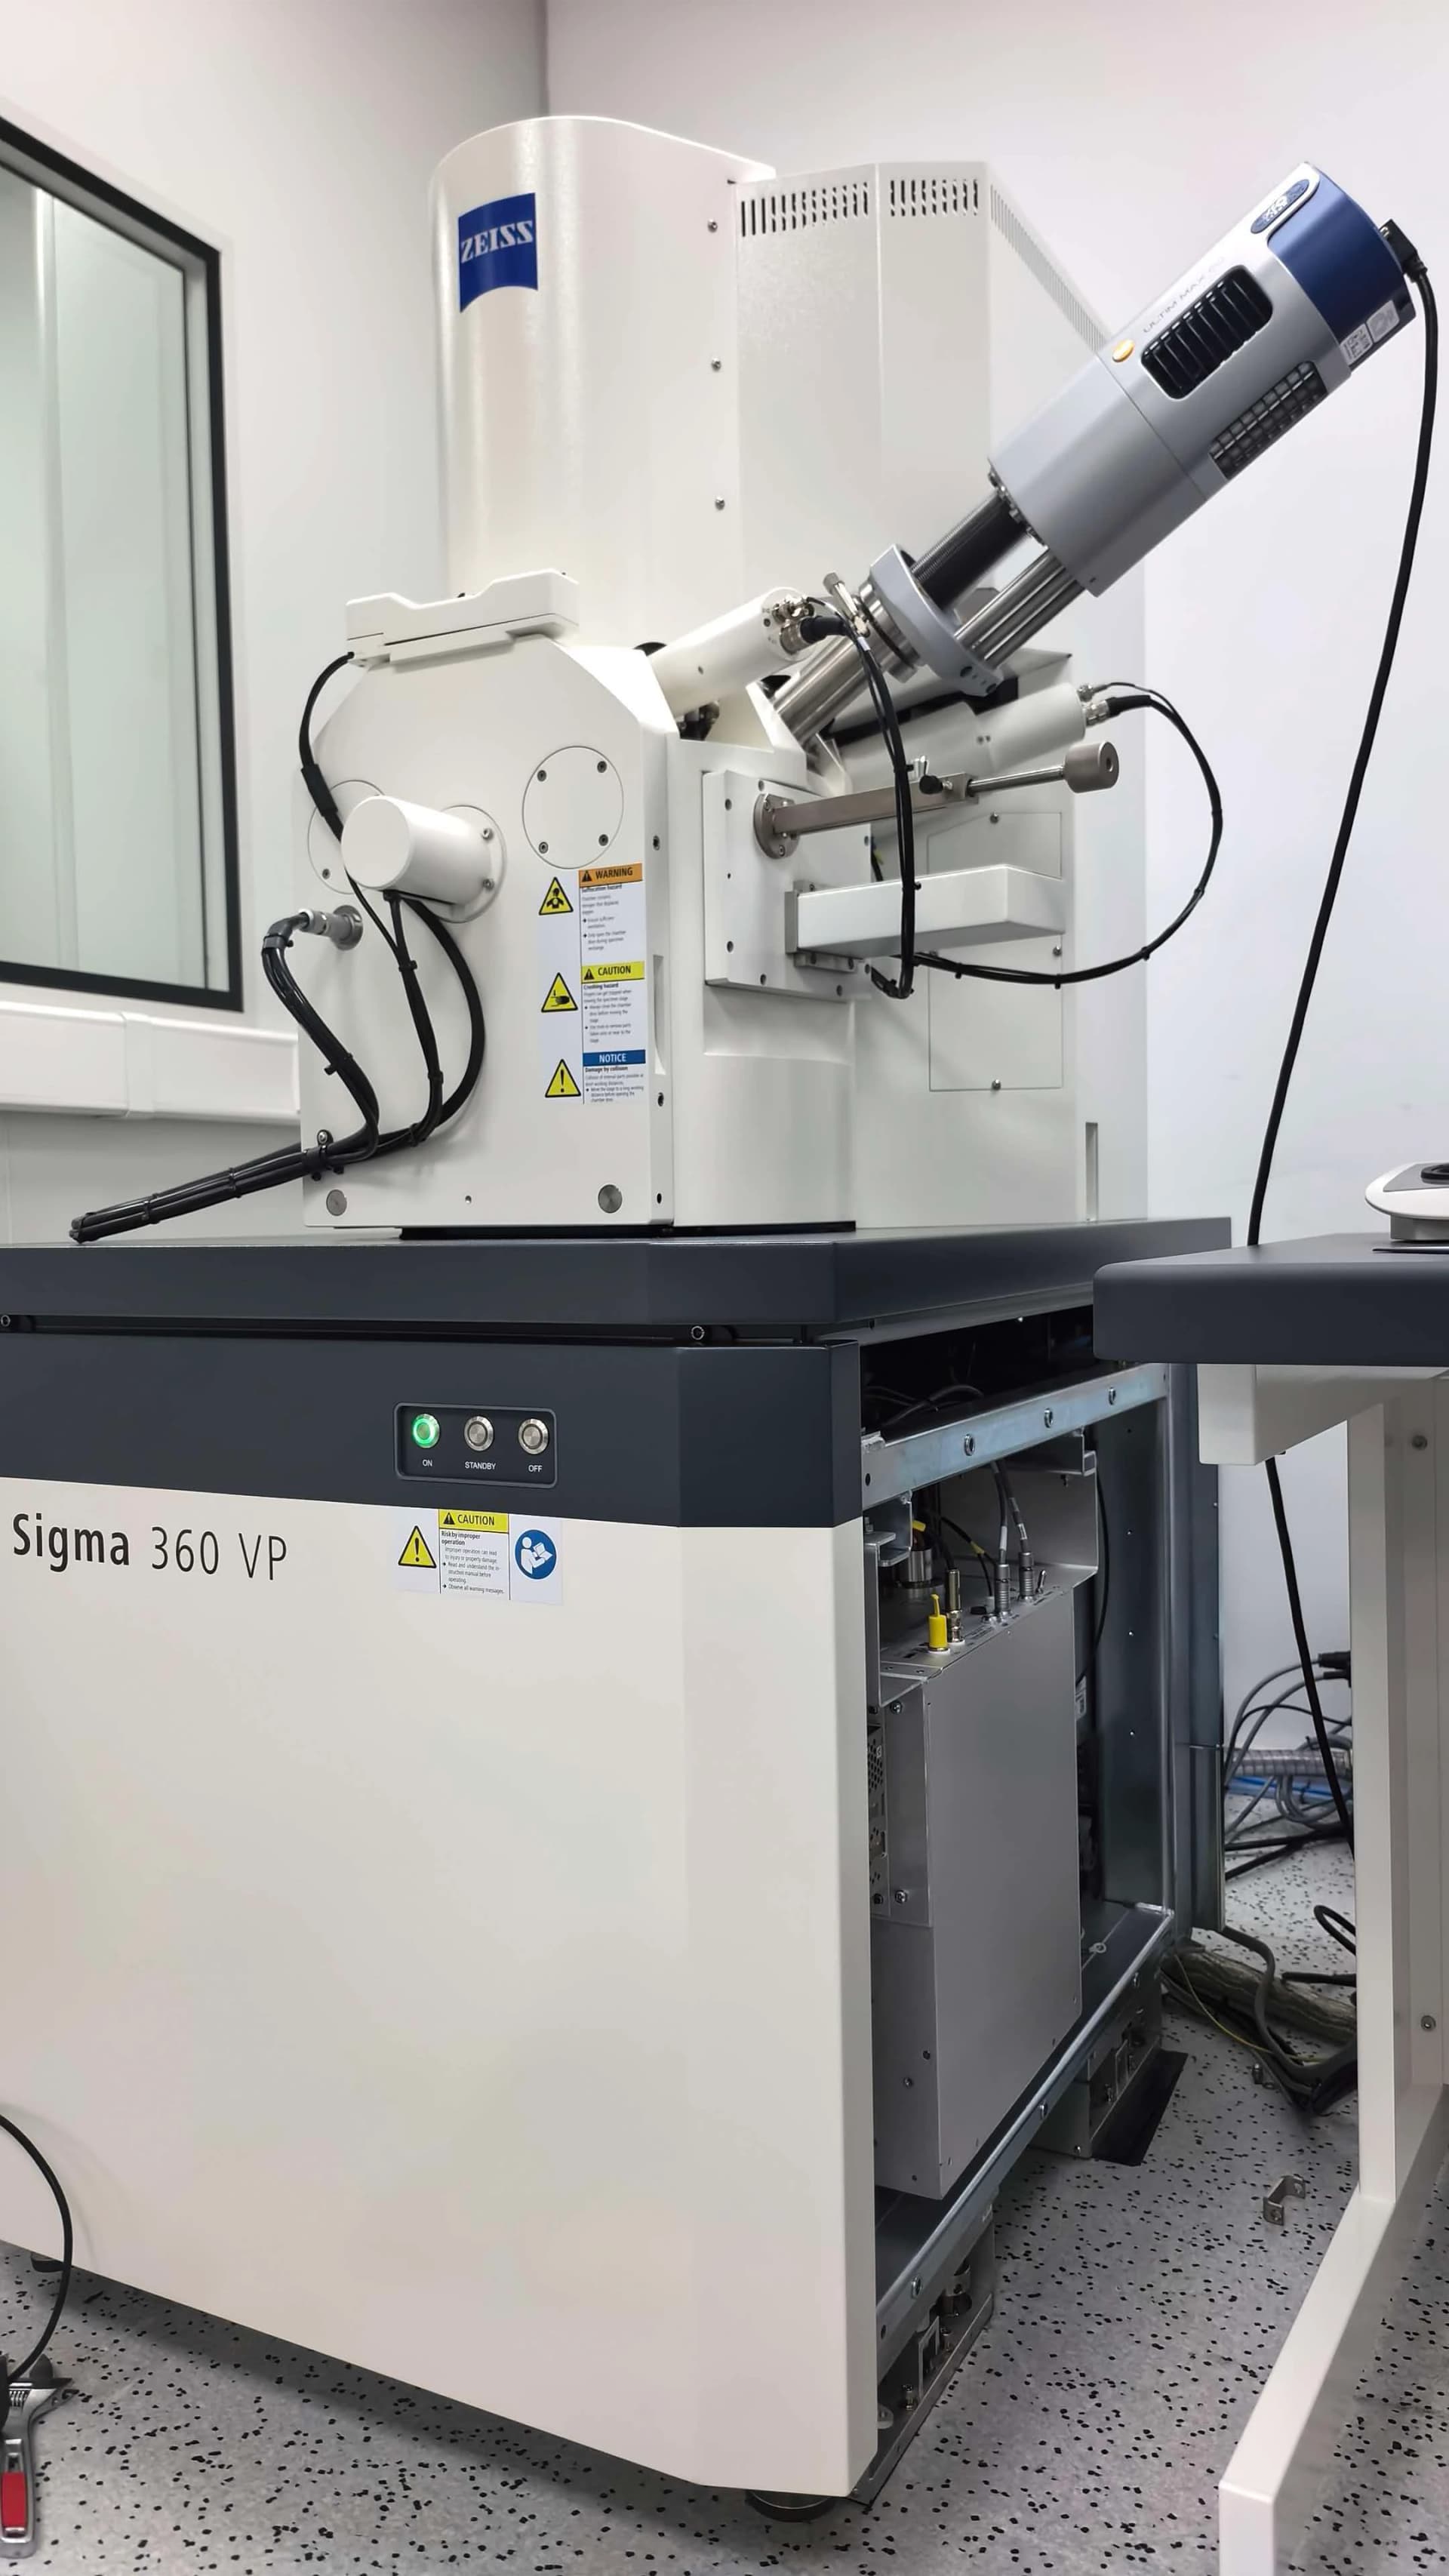
ZEISS Sigma 360 FE-SEM DVIA-ULF700 Installation Report
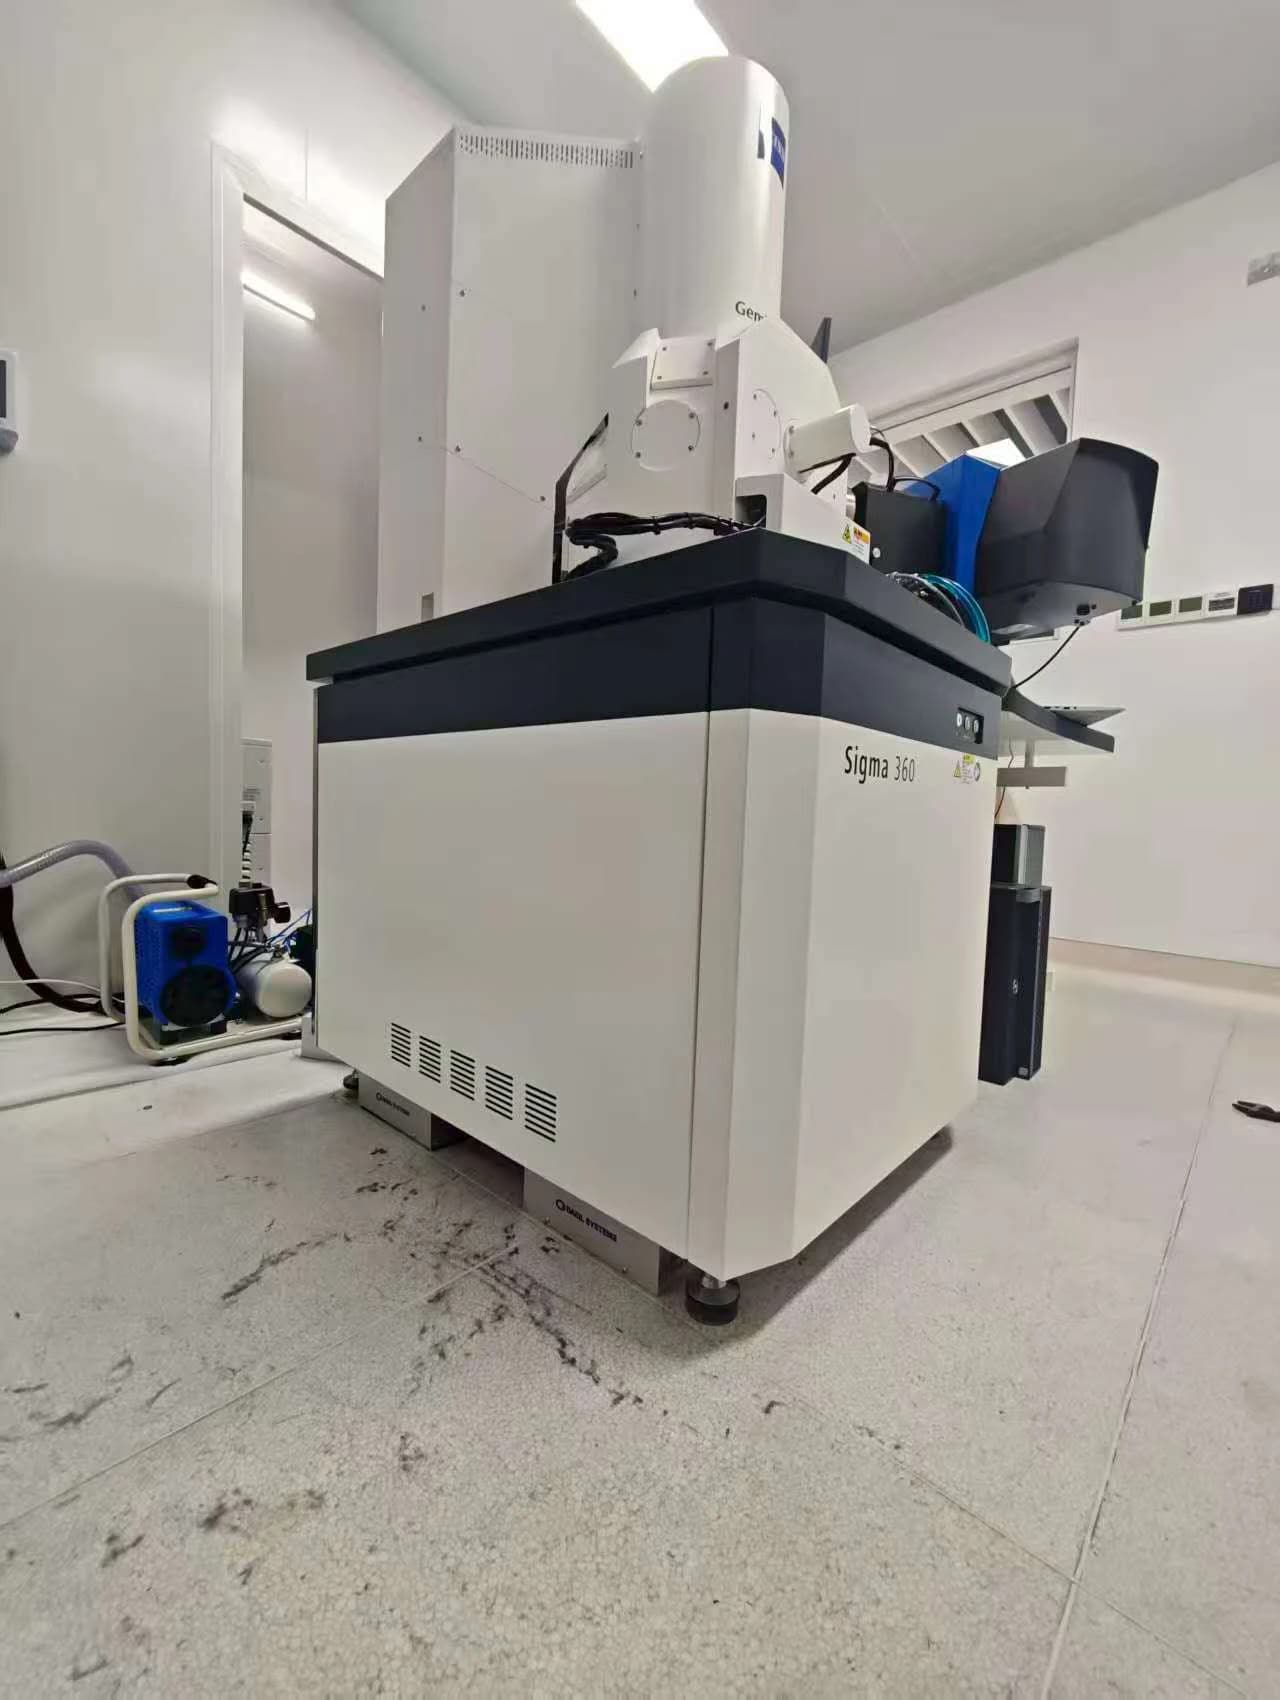
Greater Bay Area Quantum Center ZEISS Sigma 360 DVIA-ULF700 Installation Report