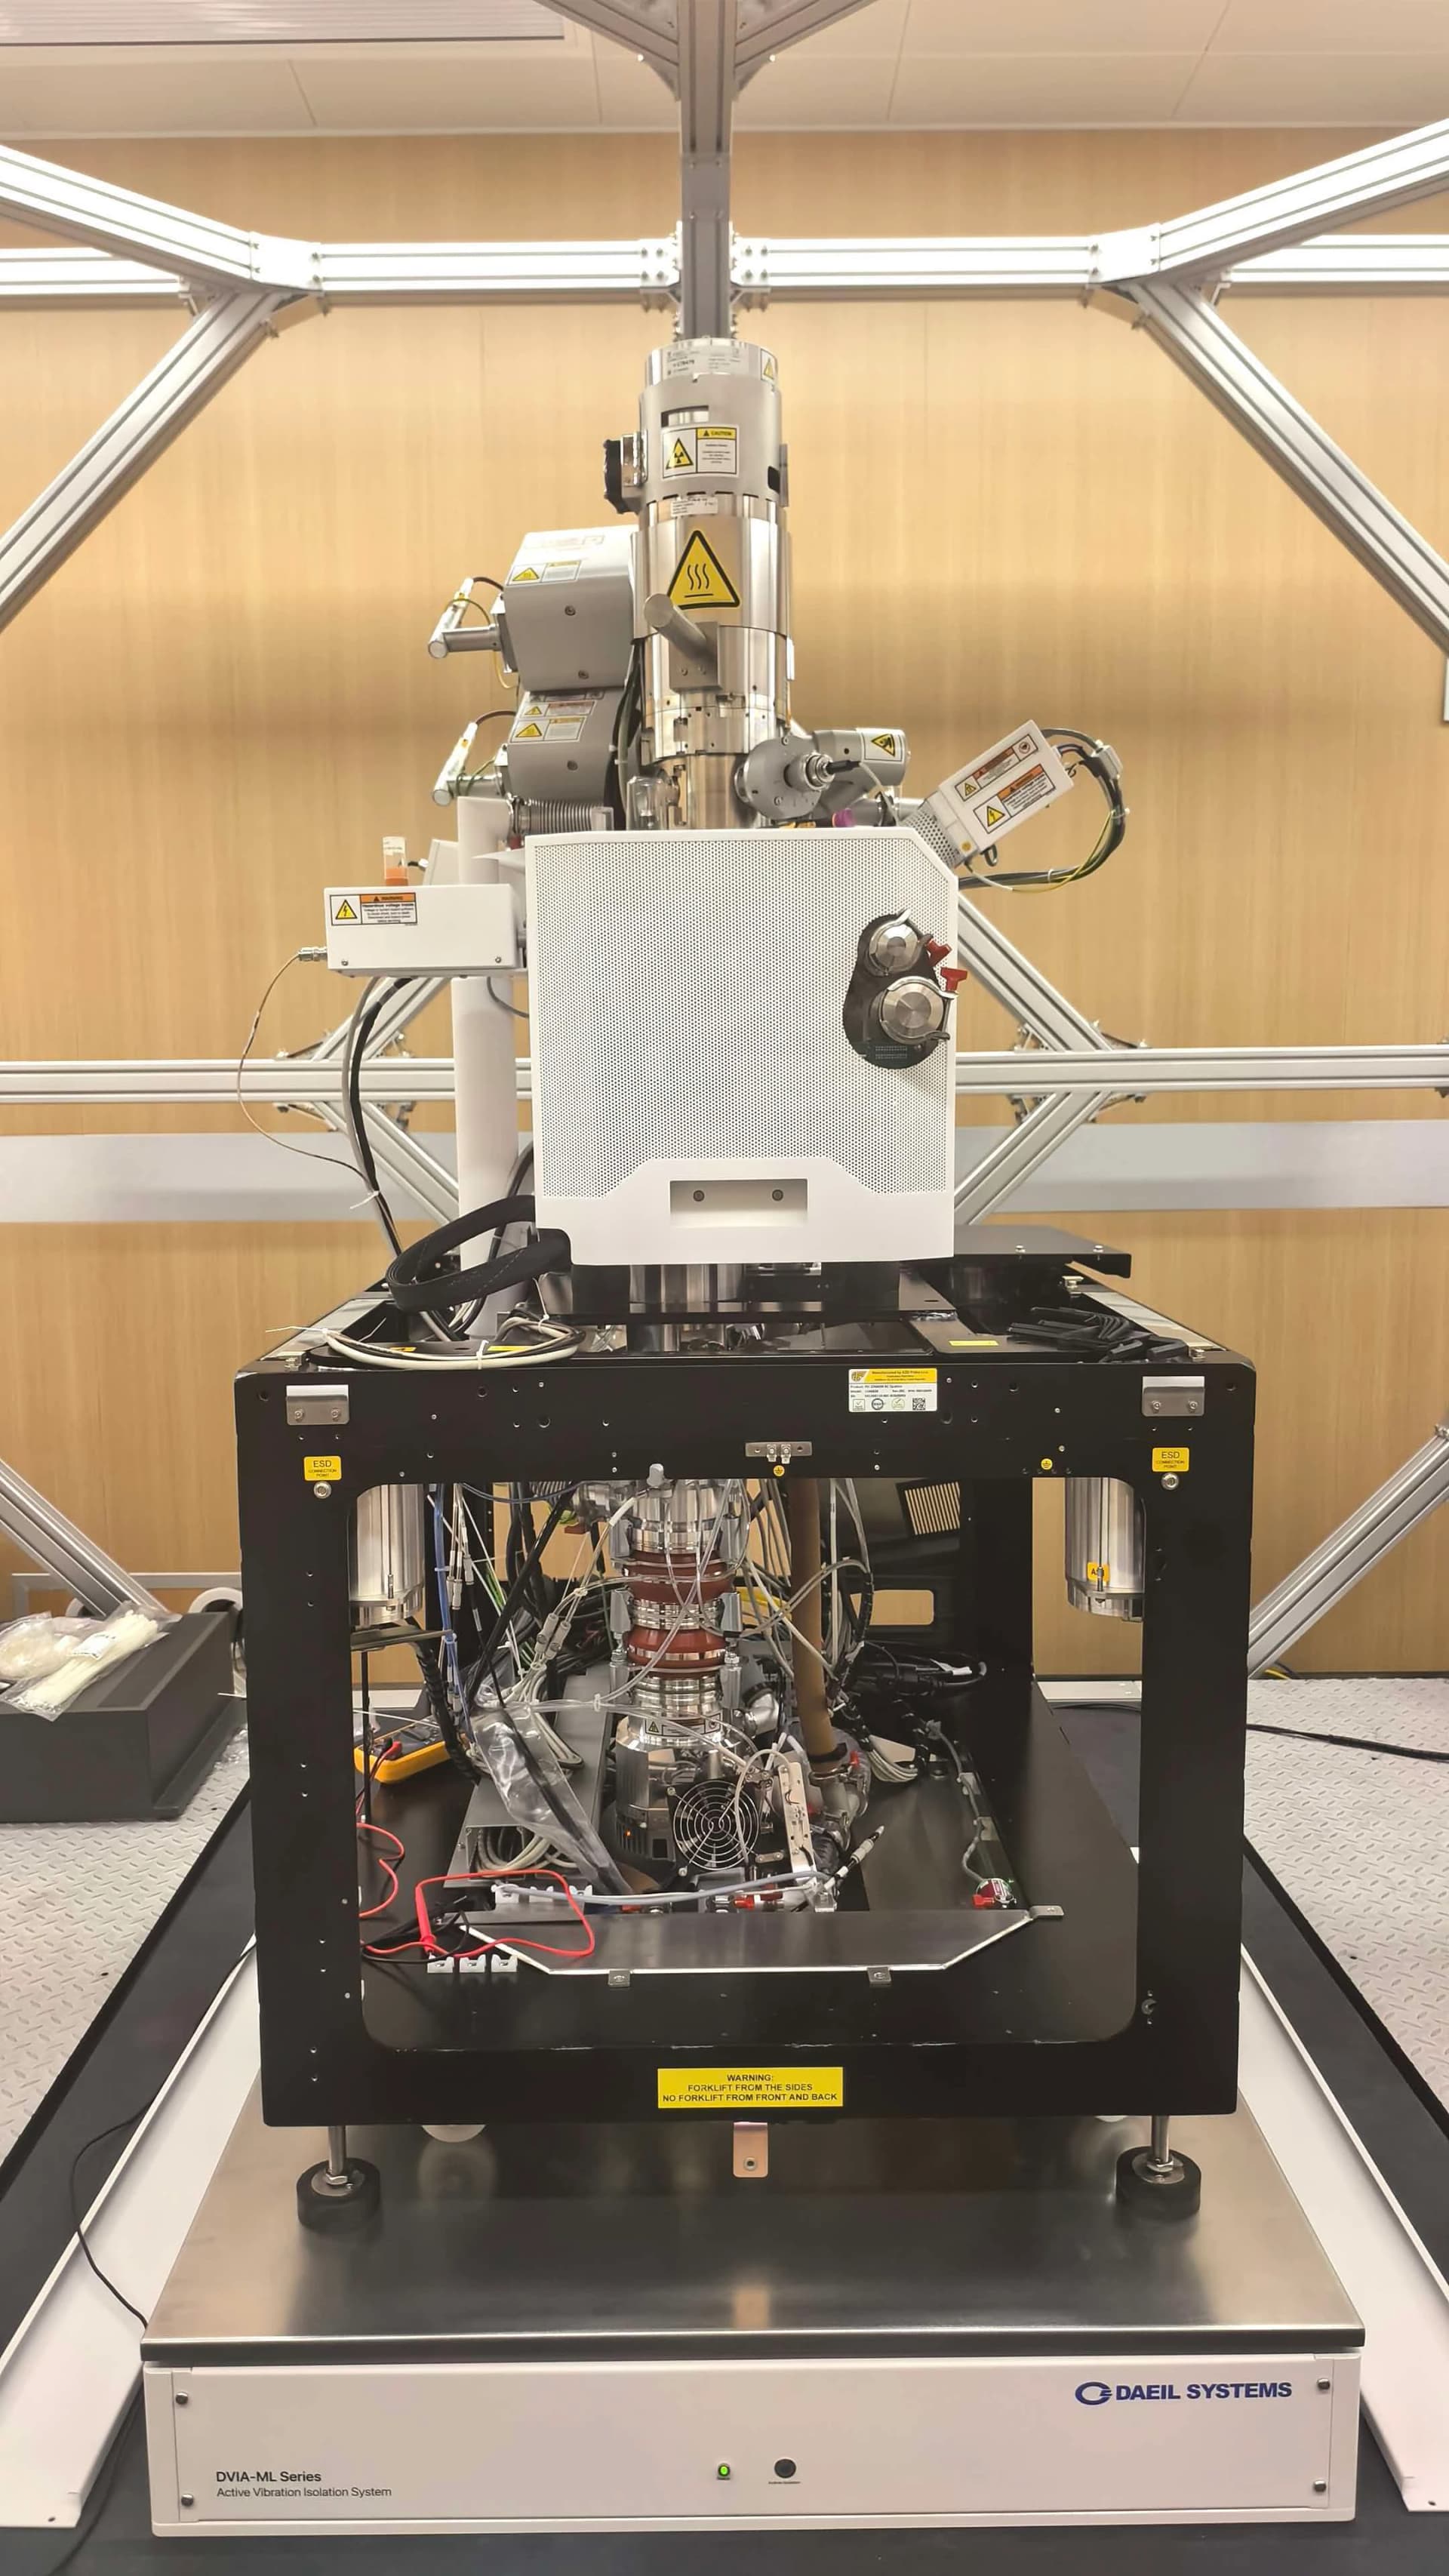
Thermo Fisher Scientific Apreo ChemiSEM DVIA-ML1000 Installation Report
Contents
Overview
Following the installation of DVIA-ML1000 at Shanghai, tuning and vibration measurement were performed.
Vibration measurement was conducted with the equipment in the Idle state.
Data is represented in VC Curve format and reference material on the vibration level is provided.
Vibration Isolation System Information
Model: DVIA-ML1000
Serial Number: 260202R1-1
Engineer
Taehun Kim · DAEIL SYSTEMS
Tuning Date
2026.08.20
End User
Opton Optics
Number of Tuning Trial
2nd
Site
Shanghai
Equipment
Manufacturer: Thermo Fisher Scientific
Equipment: SEM
Model: Apreo ChemiSEM
Vibration Specification
VC-F
Equipment Condition
Idle
Tuning Request
Conclusion
Vibration measurements were performed at two positions, the installation floor and the top surface of the DVIA-ML1000 active vibration isolation system, with the equipment in the Idle state.
The equipment manufacturer specified VC-F (1.56 µm/s, 1/3-octave band RMS velocity) as the vibration criterion for this installation. The isolation performance was evaluated against this criterion.
In all three axes (X, Y and Z), the vibration levels on the isolation platform remained below the VC-F criterion across the entire measured frequency range of 1–100 Hz. The maximum platform levels were 0.66 µm/s (X), 0.35 µm/s (Y) and 0.46 µm/s (Z), all of which are also below the VC-G level (0.78 µm/s). Over most of the frequency range, the platform levels were significantly lower than the corresponding floor levels, which confirms effective attenuation of floor-borne vibration in the low-frequency region critical to the equipment. In a few high-frequency bands (around 50–80 Hz in the vertical axis), the platform level was comparable to or slightly higher than the floor input. However, the absolute levels in these bands remained well below the specified criterion.
Based on these results, the isolation system is confirmed to be operating as intended and meets the VC-F requirement in both the vertical and horizontal directions.
Measurement Summary
| Measurement Point | Vibration Specifications | Axis | Result | |
|---|---|---|---|---|
| Floor | DVIA-ML1000 | |||
| 1. Floor 2. DVIA-ML1000 | See Section 9 | Vertical | ✗ FAIL | ✓ PASS |
| Left to Right | ✗ FAIL | ✓ PASS | ||
| Front to Back | ✗ FAIL | ✓ PASS | ||
Measurement Data Obtained via UI Program
Vertical
Vertical — VC Curves
Left to Right
Left to Right — VC Curves
Front to Back
Front to Back — VC Curves
Installation Photo
Equipment
Reference
The table below classifies vibration levels based on IEST-RP-CC012.2.
Notes:
1. As measured in one-third octave bands of frequency over the frequency 8 to 80 Hz (VC-A and VC-B) or 1 to 80 Hz (VC-C through VC-G).
2. The detail size refers to the width in the case of microelectronics fabrication, the particle (cell) size in the case of medical and pharmaceutical research, etc. It is not relevant to imaging associated with probe technologies, AFMs, and nanotechnology.
The information given in this table is for guidance only. In most instances, it is recommended that the advice of someone knowledgeable about applications and vibration requirements of the equipment and processes be sought.
Share this Case Study
Case Study Information
Related Case Studies
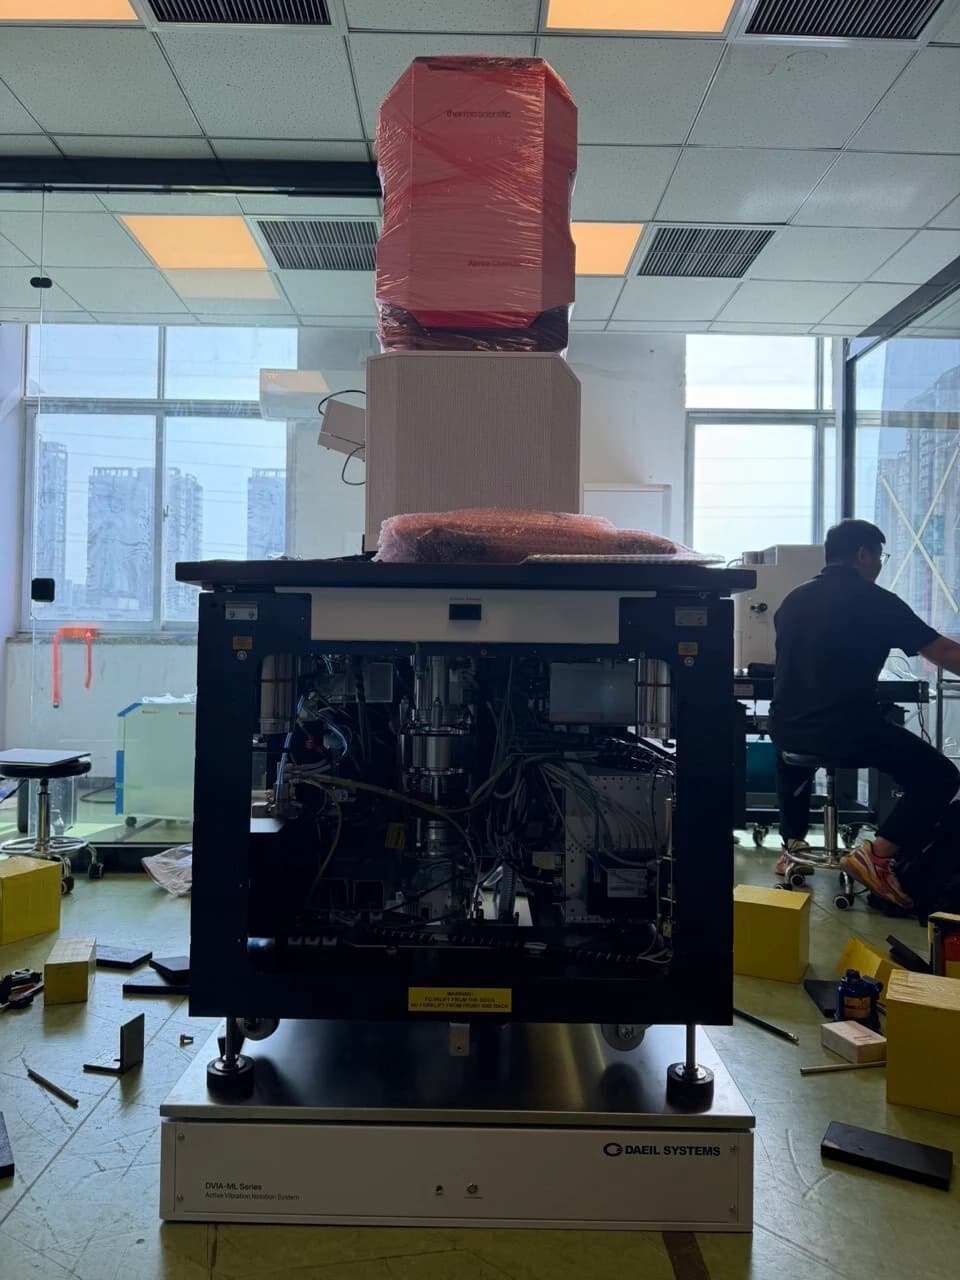
Thermo Fisher Scientific Apreo ChemiSEM S HiVac DVIA-ML1000 Installation Report
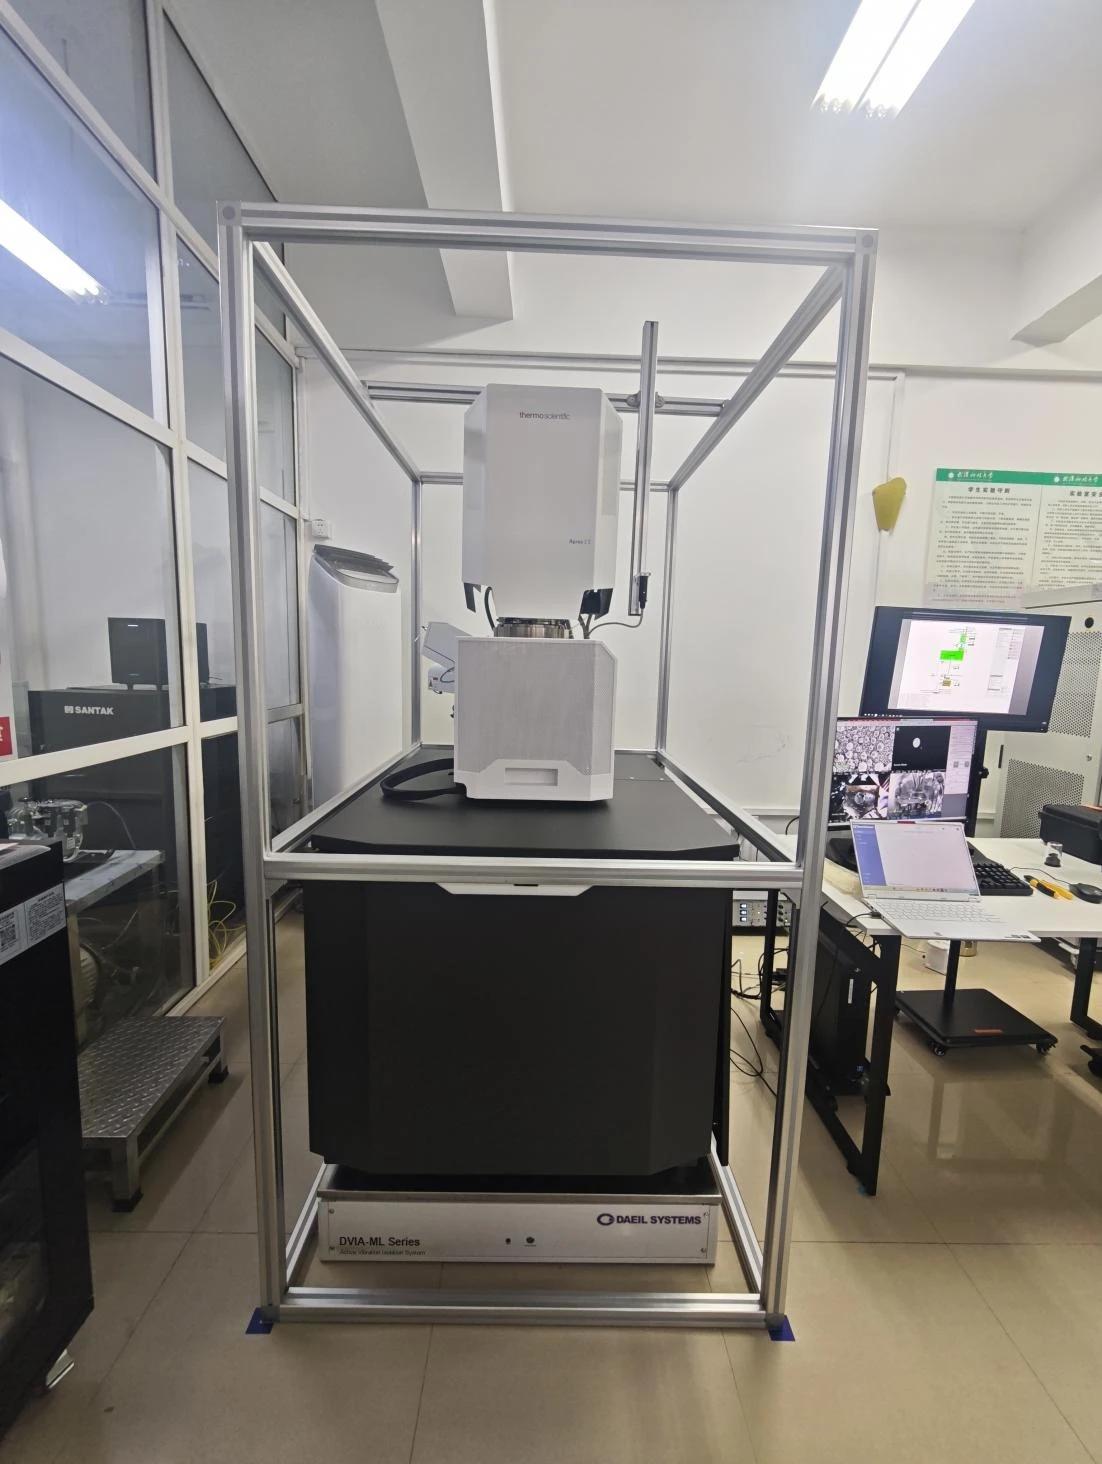
Thermo Fisher Scientific Apreo 2S HiVac DVIA-ML1000 Installation Report