Mutec Korea DVIA-T76 (250715R2) Inspection Report
Contents
Author
Engineer: Chaewon Lee
Measurement Date
October 31, 2025
Report Written Date
October 31, 2025
Overview
Inspection was performed on the DVIA-T76 installed in the 1F cleanroom at Mutec Korea.
When the equipment moved at maximum speed, the isolator top-plate Settling time was very long; tuning was performed to address this.
Tuning and vibration measurements were conducted with the equipment installed and in a Turned on/IDLE state.
Data are presented as VC curves, and Reference materials are provided for the vibration levels.
Vibration Isolation Platform
Model: DVIA-T76
Serial number: 250715R2
Engineer
Chaewon Lee from DAEIL SYSTEMS, field engineer
Inspection Date
October 31, 2025
Installation Site
Mutec Korea 1F cleanroom
End User
Mutec Korea
Customer Equipment
Manufacturer: Mutec Korea
Equipment: Semiconductor inspection equipment
Model: MG
Equipment Specification
-
Equipment Status
Equipment installed / Turned on/IDLE
Measuring Equipment
10.1) Data Physics DAQ
-Hardware: QUATTRO, Serial Number: 22436
-Software: SignalCalc ACE
10.2) Accelerometer
PCB Accelerometer
Model: 393B05
Vibration Measurement Setup
F Span: 200 Hz
Lines: 3200
Engineering Units: m/s
Window: Hanning
Averaging: FFT Spectrum Averaging
Averaging mode: Exponential, 40
Conclusion
During the initial inspection, when the stage was operated at 200 m/s, the Settling Time on the isolator top plate was measured at approximately 6 seconds.
To reduce the Settling Time, the isolator flotation height was changed to increase spring stiffness, and tuning was performed to improve isolator performance.
After tuning, the Settling time was confirmed to have decreased to approximately 2 seconds.
Measurement Data
| Place of Measurement | Status | Direction | Floor | DVIA-T76 |
|---|---|---|---|---|
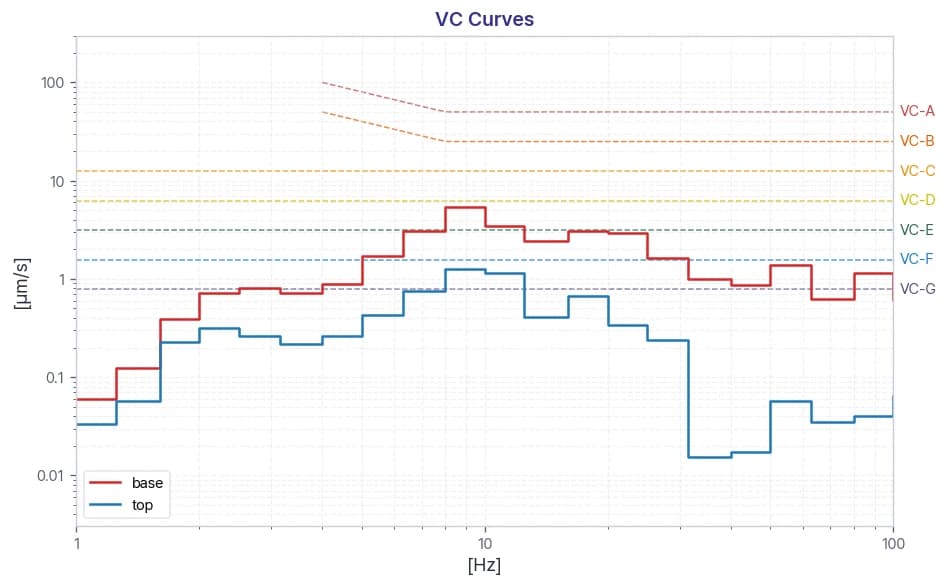
| Mutec Korea 1F cleanroom 1. Floor vibration 2. DVIA-T76 | Equipment installed / Turned on/IDLE | Vertical | VC-E @ 16 Hz | VC-G @ 16 Hz |
| Left to Right | VC-C @ 50 Hz | VC-G @ 50 Hz | ||
| Front to Back | VC-C @ 100 Hz | VC-G @ 100 Hz |
Data and Image
Before/After Settling Time Comparison
Settling Time Before Tuning (approx. 6 s)
Settling Time After Tuning (approx. 2 s)
Vibration Measurement Data
Vertical VC Curves
Vertical Autospectrum
Vertical Transmissibility
Left to Right VC Curves
Left to Right Autospectrum
Left to Right Transmissibility
Front to Back VC Curves
Front to Back Autospectrum
Front to Back Transmissibility
Reference
Notes:
1. VC-A/B is measured in 1/3 octave bands from 8-80 Hz, VC-C through VC-G from 1-80 Hz.
2. Detail size refers to line widths in microelectronics manufacturing or particle sizes in medical research.
Share this Case Study
Case Study Information
Related Case Studies
Pharrics BV MPI Corporation Probe Station MPI TS150 DVIA-T67 (260402R1) Installation Report
KimTechnix Keyence VK-X4000 Laser Scanning Confocal Microscope DVIA-TD45 (260616R5) Installation Report
