Vibration Isolation for AFM: Z-Noise, Site Limits, and Platform Selection
Why AFM is the most vibration-sensitive lab instrument, where Z-noise comes from, and how to choose between tabletop and modular active isolation platforms.
Last updated
1.Why Is AFM the Most Vibration-Sensitive Instrument in Your Lab?
An atomic force microscope holds a probe tip within a few nanometers of — or in gentle contact with — the sample surface, and reads topography by keeping that interaction constant. The vertical scale it resolves is measured in ångströms: a single atomic step on silicon or graphite is roughly 2–4 Å high, and a good instrument's electronic noise floor sits below one ångström. This is what makes the AFM the most vibration-sensitive instrument in most labs. Any relative motion between tip and sample that the Z feedback loop cannot distinguish from topography is recorded as topography. Floor vibration does not blur an AFM image the way it blurs an optical or electron-beam image; it fabricates surface features that were never there, and no post-processing can separate them from real ones.
The failure signatures are characteristic. Vertical (Z) input raises the height-channel noise floor until atomic terraces and sub-nanometer grain structure disappear. Lateral input draws periodic ripple across the slow-scan direction and streaks along the fast axis. Because the tip moves at a known velocity, the ripple even encodes its own cause: the scan speed divided by the spatial period of the pattern gives the disturbance frequency — a diagnostic worth running before blaming the tip or the sample. The VC vibration criteria acknowledge this sensitivity class explicitly: the detail-size column of the VC table ties sub-micrometer imaging directly to probe technologies, AFMs, and nanotechnology.
2.Where Does AFM Noise Actually Come From?
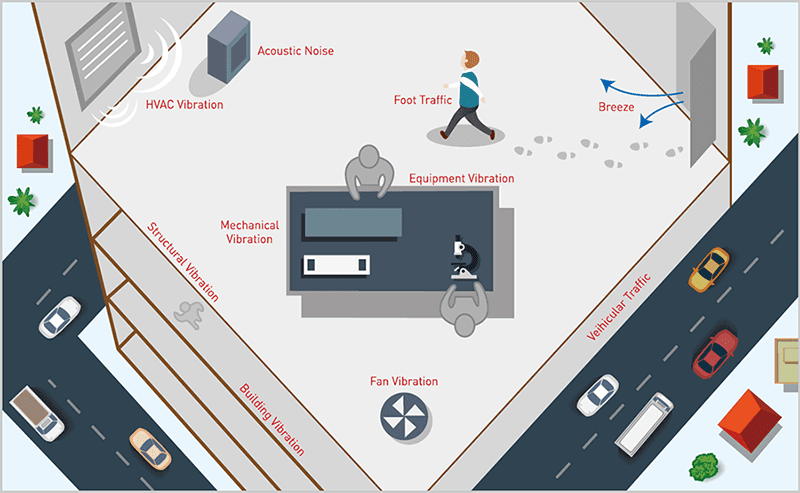
Three external frequency bands dominate, and each behaves differently. Below about 5 Hz, buildings sway with wind loading and road or rail traffic, and upper floors respond as slow spring-mass systems. This band carries a large share of total vibration energy and is precisely where a passive air table performs worst: pneumatic isolators resonate at 1.2–3.0 Hz, so they amplify the input instead of removing it and only begin isolating effectively above roughly 5–10 Hz. From about 5 to 30 Hz, slab resonances, footfall, door closures, and rotating machinery dominate; suspended floors are liveliest at mid-span and quietest near columns and shear walls. Above the structural band, HVAC fans, pumps, and transformers contribute discrete tonal peaks at rotation frequencies and their harmonics — narrow lines that print as regular ripple in images.
Air adds a fourth path. An AFM cantilever and the instrument's covers respond to sound pressure directly, so conversations, HVAC hiss, and hallway noise can appear in the height channel even on a perfectly still floor — the reason research AFMs live inside acoustic enclosures. Finally, the instrument contributes its own sources: controller cooling fans, vacuum pumps sharing the bench, and cables that bridge the isolated platform to the outside world, each a shortcut around whatever isolation sits underneath. A complete AFM noise budget accounts for every one of these paths, not just the floor.
3.What Does "Good Enough" Look Like? Z-Noise Targets and VC Mapping
Two numbers define "good enough": the instrument's Z-noise floor and the site's VC class. Measure the first directly. Engage the tip on a rigid, flat sample, set the scan size to zero, and record the height signal; the RMS of that trace is the effective Z-noise floor of instrument plus environment. If it approaches the height of the features you study — a few ångströms for atomic steps, a nanometer for fine grain structure — vibration is limiting your data. Repeating the measurement with the isolation system switched on and off separates environmental noise from the instrument's own electronic floor.
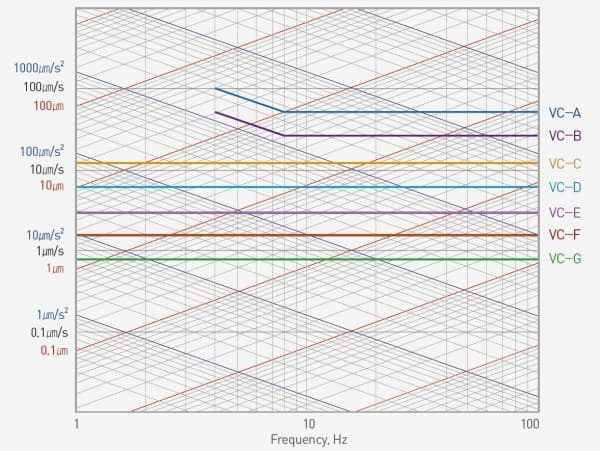
At the facility level, AFM work is generally associated with VC-D (6.25 μm/s) or VC-E (3.12 μm/s) environments, alongside high-resolution SEM and e-beam systems; moderately sensitive work may tolerate VC-C (12.5 μm/s). The VC table's detail-size column makes the link explicit: detail sizes of 0.1–0.3 μm correspond to VC-D, and below 0.1 μm to VC-E. Treat the AFM vendor's floor-vibration specification as the contractual requirement, and use the VC class as the shared language for comparing it with a tri-axial site survey measured at the actual bench position — not a corridor average, and not a single quiet-hour snapshot.
4.Benchtop AFM: Is a Tabletop Active Platform Enough?
Most benchtop AFMs sit on lab benches in shared rooms — an environment that is notoriously hard to control. The tabletop answer is the DVIA-T, an active platform that replaces the passive air table under a benchtop AFM. It senses motion with inertial velocity sensors (sensitivity 100.4 V/m/s) and drives frictionless electromagnetic actuators in all six degrees of freedom, with an active bandwidth of 0.5–200 Hz. Isolation reaches up to 80–90% at 1 Hz — the band where a passive table amplifies — and up to 90–99% at 2 Hz and above. Feedback on the platform corrects residual motion, while feedforward floor sensors cancel incoming vibration before it reaches the payload.
For a benchtop instrument the practical details matter as much as the numbers. The DVIA-T needs no compressed air: it connects to a standard AC outlet, auto-levels with ±0.08 mm repeatability whenever the payload changes, and is operating within minutes of unboxing. Four platform sizes span 420 × 500 mm to 700 × 800 mm, all 93 mm tall, with payload options of 90, 150, or 250 kg — covering compact research AFMs with margin to spare. A built-in interface displays transmissibility, auto-spectrum, and VC-curve plots, so the isolation-off/on vibration spectra that accompany the Z-noise acceptance test can be captured and documented from the platform itself.

5.What About Research-Grade AFM and Combined Systems?
Research-grade systems break the tabletop mold: large-sample AFMs on granite frames, AFMs combined with inverted optical microscopes, and probe systems integrated into SEM chambers or ultra-high-vacuum clusters. For these, DVIA-ULF modular isolators install as independent units directly under the instrument frame. Each unit stands only 91–101 mm tall — the lowest active isolator DAEIL SYSTEMS has designed — so it slips under an existing frame without re-engineering the setup. Four models carry from 400 kg (ULF350) to 1,600 kg (ULF1500), with the same 0.5–200 Hz active bandwidth, isolation of up to 70–90% at 1 Hz and up to 90–99% at 2 Hz, and stability at the sub-micron translational and sub-microradian angular level across the bandwidth — the figure of merit that matters when tip-sample forces are measured at the atomic scale.
When the AFM is part of a heavier combined tool — a probe stage inside an electron microscope, or a shared platform carrying the microscope plus ancillary optics — DVIA-ML custom platforms extend the same active vibration isolation principle to payloads up to 6,000 kg (ML6000), with magnetic emission designed below 0.05 μT so the platform stays invisible to any electron optics sharing the chamber. Across the range the control principle is identical — six-degree-of-freedom feedback plus feedforward — and the engineering record spans more than 1,000 documented installations. Platform choice is a matter of mass, footprint, and integration level, not of principle.
6.What Should AFM Operators Check Before Blaming the Tip?
Before attributing noise to the tip, the sample, or the instrument, walk through the environment. First, siting: a ground-floor slab or a spot near a column line beats mid-span on an upper floor, and distance from mechanical rooms, elevators, and loading docks pays off directly. Second, the survey: measure tri-axial spectra at the actual bench position across representative hours, and note every tonal peak — each one is a candidate for image ripple later. Third, the bench itself: verify the platform's load rating against instrument plus accessories, center the mass, and re-run auto-leveling after any payload change. Fourth, bypass paths: route cables with slack loops and strain relief so they never rigidly bridge the isolated platform to the bench or wall, and move controller boxes, pumps, and fans off the isolated surface. Fifth, acoustics: use the enclosure, and keep the AFM away from doors and air diffusers.
Then verify — rather than assume — that isolation works. Run the zero-scan Z-noise test with active isolation off and on, and compare the spectra: a healthy installation shows the low-frequency content collapse the moment the loop engages. If a specific ripple persists, convert its spatial period to a frequency and hunt the matching tonal source. Ten minutes of this discipline routinely recovers resolution that no hardware upgrade can buy back.