Vibration Isolation for SEM and AFM: Requirements and Solutions
How floor vibration degrades SEM and AFM data, which VC criteria apply, and how to match active vibration isolation for electron microscopes and AFMs.
Last updated
1.How Vibration Corrupts SEM and AFM Data: Two Different Mechanisms
An SEM builds its image serially: the beam dwells on one pixel at a time while the detector integrates a signal. Any relative motion between the electron column and the sample during that raster is written into the image as a position error. At 100,000x magnification the field of view is on the order of a micrometer, so a few nanometers of beam-sample relative displacement spans a pixel or more. The visible symptom is loss of edge acuity: edges look blurred or serrated, most strongly perpendicular to the fast-scan axis. Because the raster is periodic, a single-frequency floor input often prints as a regular corrugation on vertical edges, and the spatial period of that ripple encodes the disturbance frequency — which makes a high-magnification edge scan a useful diagnostic in itself.
An AFM fails differently. Its Z feedback loop holds the tip-sample interaction constant, so any relative Z motion between tip and sample that the loop cannot distinguish from topography is recorded directly in the height channel. Floor vibration therefore sets a lower bound on the instrument's Z-noise floor: once residual tip-sample motion approaches an atomic step height, single-atomic-layer terraces disappear into noise. Lateral vibration adds streaking and periodic ripple along the slow-scan direction. The critical distinction is this: SEM vibration artifacts degrade sharpness, while AFM vibration artifacts are indistinguishable from real surface features. Corrupted height data cannot be recovered in post-processing.
2.The Column-Lever Effect: Why Rotational Control Matters
Translational floor motion is only part of the problem. A floor-standing SEM places its sample at the end of a long mechanical path — column, chamber, stage — so the sample plane sits far from the platform's effective pivot. When the supporting platform rotates by a small angle, a point at lever distance L moves laterally by approximately L times that angle. The numbers are unforgiving: a rotation of one microradian, far too small to perceive, displaces a point one meter away by a full micrometer — roughly three orders of magnitude above the feature sizes a modern SEM resolves. AFMs with tall gantries or stacked stages suffer the same geometric amplification.
Two design consequences follow. First, vertical-only or three-axis isolation is insufficient for microscopy. Tilt about the horizontal axes converts directly into beam-sample lateral error, so an isolation system must sense and actively control all six degrees of freedom: X, Y, Z, and the rotations θx, θy, θz. Second, electron microscopes are top-heavy. A high center of gravity above soft supports produces coupled rocking modes in which horizontal floor input excites rotation, and that rotation feeds back into lateral sample motion — precisely the regime where undamped pneumatic supports behave worst. DAEIL SYSTEMS' DVIA platforms sense and drive all six degrees of freedom, so rotational modes are actively damped rather than left to ring at the suspension's natural frequency.
3.VC Criteria in Practice: Reading a Site Survey
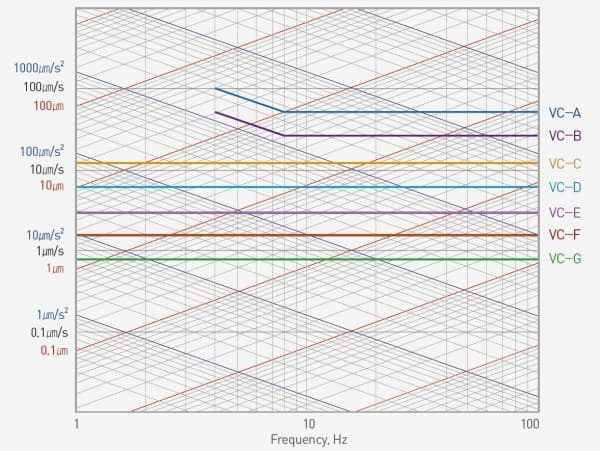
Generic vibration criteria (VC) curves, VC-A through VC-G, specify the allowable one-third-octave-band RMS velocity for vibration-sensitive environments, with each step a factor-of-two tightening: VC-A permits 50 μm/s, VC-C 12.5 μm/s, VC-E 3.1 μm/s. Commonly cited guidance associates mid-magnification SEM work with VC-C environments, and high-resolution SEM, AFM, and e-beam systems with VC-D or VC-E. The instrument vendor's floor specification remains the contractual reference; VC classes are the common language for comparing it against a real site.
A proper site survey reports tri-axial velocity spectra — vertical plus two horizontal — measured at the exact proposed instrument footprint, presented in one-third-octave bands and captured across representative conditions: production hours versus night, HVAC on versus off, nearby foot traffic. Two features deserve the closest attention. Discrete tonal peaks trace to rotating machinery such as air handlers and pumps; broadband low-frequency energy from road traffic and slab response varies through the day. The report should state not only the worst-case class but which frequency bands fail and by how much, because that determines the fix.
For sites that fail at low frequency, DVIA-ML active platforms are specified to support installations across VC-B through VC-G class environments within the instrument classes DAEIL SYSTEMS supports — the survey data determines which platform configuration applies.
4.Placement Realities: Upper Floors, HVAC, and Traffic
The best vibration site is a ground-floor slab on grade, far from mechanical rooms and roads. Most instruments do not get that site. Suspended floors in multi-story buildings act as spring-mass systems with their own resonances; footfall, door closures, and rooftop machinery excite the slab, and the response is worst at mid-span and smaller near columns and shear walls. If an upper-floor location is unavoidable, measure at the actual footprint and, where possible, position the instrument close to a column line.
HVAC plant produces the other signature problem: discrete tonal peaks at fan and pump rotation frequencies and their harmonics, present whenever the plant runs — which in a fab or hospital is always. Road and rail traffic contribute broadband low-frequency bursts that vary through the day, which is why single-snapshot surveys mislead.
The frequency content is what makes these placements hard. Most of the energy from slab resonance, traffic, and building sway lands below roughly 20 Hz, with a large share below 5 Hz. Passive pneumatic isolators have natural frequencies of 1.2-3.0 Hz: they amplify input near resonance and isolate effectively only above roughly 5-10 Hz, so on a lively upper floor they can make the dominant band worse. Active systems isolate from 0.5 Hz upward, and feedforward control — floor-mounted sensors measuring incoming vibration and canceling it before it reaches the payload — is particularly effective against the repeatable tonal content that HVAC equipment produces.
5.Matching the Isolation Platform to the Instrument
Selection starts from three inputs: the instrument's mass and footprint, the survey's failing frequency bands, and the installation constraints of the room.
For compact benchtop SEMs and AFMs, DVIA-T tabletop platforms carry the instrument directly. Their geophone-based control loop responds in under 0.5 ms on some models — fast enough to counter a disturbance within a fraction of its cycle. For custom frames, laser setups, and AFMs integrated into larger assemblies, DVIA-ULF modular isolators install under the payload as independent units. Floor-standing SEM, TEM, and e-beam instruments call for DVIA-ML custom platforms: active bandwidth of 0.5–200 Hz, isolation reaching up to 80–90% at 1 Hz (and above 90% beyond 2 Hz), and payload capacity up to 6,000 kg on the DVIA-ML6000. DVIA-MLP is the pre-engineered variant for Thermo Fisher SEMs, and DVIA-P — an active-pneumatic design using accelerometers and pneumatic servo actuators — serves semiconductor cleanroom tools such as CD-SEM, DR-SEM, and photomask inspection systems.
All of these implement active vibration isolation with combined feedback and feedforward control in six degrees of freedom; they differ in form factor, actuation, and load capacity, not in principle. The practical rule: match the platform to the instrument class first, then verify against the site survey that the failing bands fall inside the system's isolation bandwidth.
| Model | Form factor | Target instruments | Key specification |
|---|---|---|---|
| DVIA-T | Tabletop | Benchtop SEM, AFM | Loop response under 0.5 ms (some models) |
| DVIA-ULF | Modular isolator | Custom frames, laser setups, integrated AFM | Installs as independent units under the payload |
| DVIA-ML | Custom platform | Floor-standing SEM, TEM, e-beam | 0.5–200 Hz active band; up to 80–90% at 1 Hz, above 90% beyond 2 Hz |
| DVIA-ML6000 | Custom platform | Heavy floor-standing instruments | Payload capacity up to 6,000 kg |
| DVIA-MLP | Pre-engineered | Thermo Fisher SEM | ML-series variant matched to the instrument |
| DVIA-P | Active pneumatic | CD-SEM, DR-SEM, photomask inspection | Accelerometer feedback with pneumatic servo actuators (no electromagnetic actuators) |
All platforms sense and drive six degrees of freedom. DVIA-ML magnetic emission is below 0.05 μT. Isolation figures are stated with the frequency at which they apply — a percentage without a frequency is not a specification.
6.Magnetic-Field Caution Near Electron Optics
Electron optics are sensitive to stray AC magnetic fields as well as to vibration: a time-varying field deflects the beam and produces image displacement that mimics mechanical disturbance. SEM and TEM site requirements therefore specify field limits at the column, and the isolation platform is the one piece of powered equipment guaranteed to sit directly beneath it. Any active system using electromagnetic actuators must be evaluated as a potential field source, not assumed benign.
Two engineering answers exist. The first is emission control: DVIA-ML platforms are designed for electron-microscopy service with magnetic emission below 0.05 μT, keeping the actuators' contribution under the field levels electron-optical columns require. When comparing platforms, ask for measured emission data at the column position rather than a generic statement, and route actuator drive cables and controller electronics away from the column base. The second answer removes electromagnetic actuators from the loop entirely: the DVIA-P uses accelerometer feedback with pneumatic servo actuators — the same closed-loop principle executed with air rather than magnetics — which is one reason it is the standard choice for field-sensitive semiconductor inspection tools.
The complete SEM/AFM site checklist therefore has three columns, not two: vibration (survey against the vendor floor specification), acoustics, and magnetic environment. The isolation platform must be verified against the third even as it solves the first.