ZEISS Korea Innovation Center DVIA-MB1000 (231128R4), ZEISS FIB-SEM Crossbeam 550 Installation Report
Contents
Prepared for
ZEISS
Overview
Installation tuning and vibration measurement were conducted for the DVIA-MB1000 installed at the ZEISS KOREA Innovation Center.
Vibration was measured with the installation tuning performed while the equipment was in IDLE condition.
(To obtain precise tuning and vibration measurements, the equipment Turn off condition is necessary.)
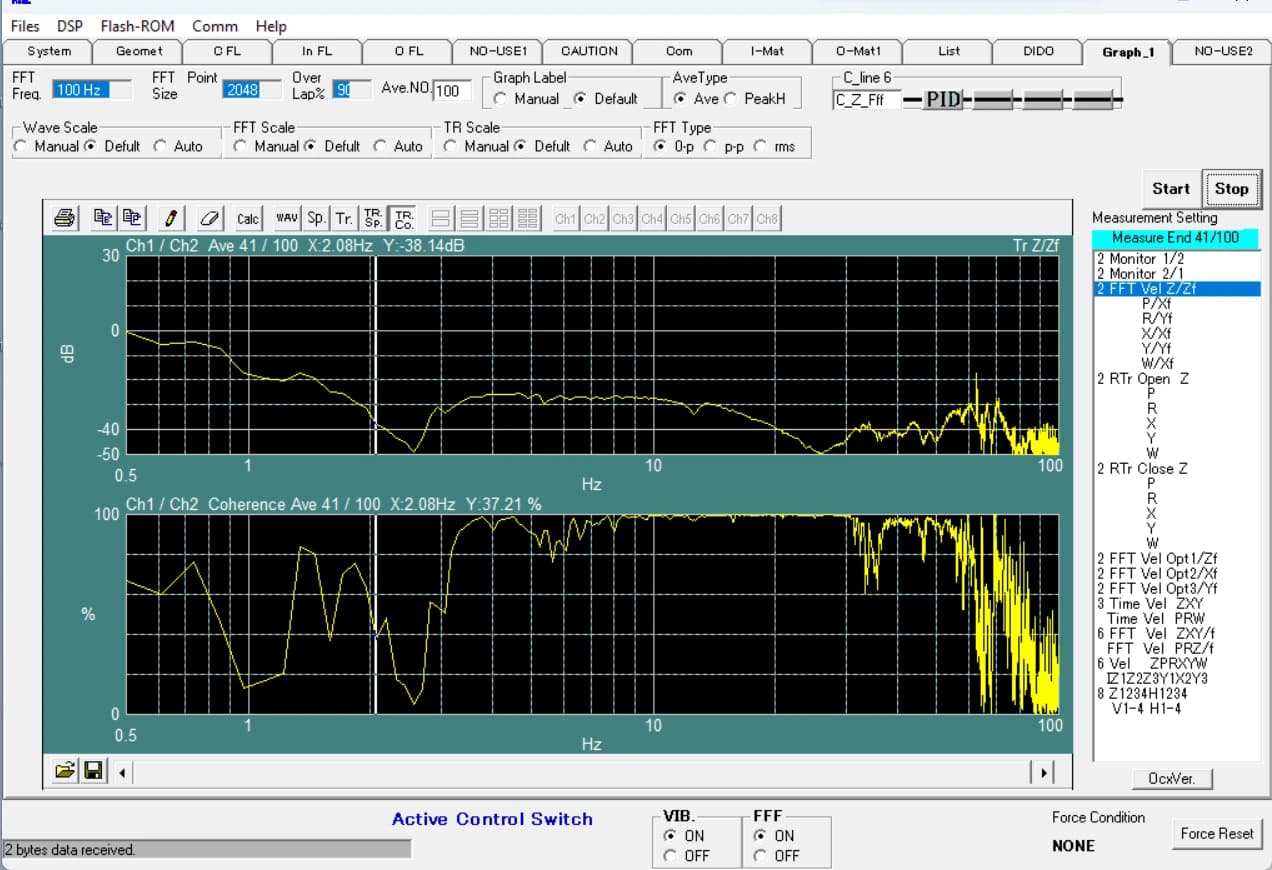
Inspection was executed through tuning via the UI Program with the DVIA-MB1000 connected to a notebook PC and vibration measurements using PULSE 22 instrumentation.
System Information
Model: DVIA-MB1000
Serial Number: 231128R4
Engineer
Jongwon Park from DAEIL SYSTEMS
Inspection Date
January 9, 2024
Report written date
February 1, 2024
Location
ZEISS KOREA Innovation Center, Hwaseong
Equipment
ZEISS FIB-SEM Crossbeam 550
Number of Tuning Trial
1st tuning
Equipment Condition
Equipment is installed / Idle
Equipment Spec
Measurement Device
10.1) PULSE 22
Hardware: Bruel & Kjaer Type 3050-A-040
Software: LapShop Application(PULSE Lapshop)
10.2) Measurement Setting
Bandwidth: 0 – 200 Hz
Lines: 801
Analyzer: FFT Spectrum Averaging
Signal Units:
Spectral Units: RMS
10.3) Accelerometer
PCB Accelerometer
Model: 393B05
Conclusion
Accelerometers mounted on the top plate and floor were used for X-, Y-, and Z-axis vibration data; results are plotted as VC curves and transmissibility curves.
Along the vertical axis in the band at or below 10 Hz, vibration at site at 8 Hz reached VC‑E at 2.87E‑06 m/s RMS, then the DVIA‑MB1000 attenuated vibration to VC‑G. Above 10 Hz at 13 Hz the site reached VC‑D at 3.96E‑06 m/s RMS, and the DVIA‑MB1000 attenuated toward VC‑G.
Along the horizontal (left–right) axis, VC‑G is maintained in the band at or below 10 Hz; above 10 Hz at 13 Hz the site VC‑F reads 1.05E‑06 m/s RMS yet the DVIA‑MB1000 attenuates toward VC‑G.
Along the front–to–back axis, VC‑G is maintained within all frequency bands summarized in the measurements.
VC‑G and VC‑F are vibration levels demanded by typical high‑end FIB‑SEM tooling.
Summary of Vibration Results
| Measurement Point | Z-axis (Vertical) 1-10 Hz | Z-axis (Vertical) 12.5-80 Hz | X-axis (Left to Right) 1-10 Hz | X-axis (Left to Right) 12.5-80 Hz | Y-axis (Front to Back) 1-10 Hz | Y-axis (Front to Back) 12.5-80 Hz |
|---|---|---|---|---|---|---|
| Floor | E(✓ PASS) | D(✗ FAIL) | G(✓ PASS) | F(✓ PASS) | G(✓ PASS) | G(✓ PASS) |
| Active | G(✓ PASS) | F(✓ PASS) | G(✓ PASS) | G(✓ PASS) | G(✓ PASS) | G(✓ PASS) |
Data and Image
13.1 Transmissibility Curve (UI Program)
Z axis (Vertical) Transmissibility
At roughly 2 Hz within the frequency band below 10 Hz the plot reads roughly −32.7 dB, attenuating slab vibration roughly 97% or more versus the foundation pickup.
Roughly −30 dB response near the roughly 10 Hz band corresponds to attenuation performance of roughly 96% or more versus foundation vibration.
Z axis (Vertical) VC Curve
At the dominant low‑frequency peaks below 10 Hz measured at about 8 Hz, VC‑E at 2.87E‑06 m/s RMS is attenuated to VC‑G. Above 10 Hz at about 13 Hz the site VC‑D at 3.96E‑06 m/s RMS is attenuated toward VC‑G at roughly 9.59E‑08 m/s RMS on the DVIA‑MB1000. Spike‑like disturbances from noise around 55 Hz and 60 Hz raise the plotted response on the isolator roughly to VC‑F; outside those peaks VC‑G is maintained elsewhere on the plotted band.
X axis (Left to Right) Transmissibility
At roughly 2 Hz below roughly 10 Hz, −22.7 dB reflects attenuating roughly ninety‑two percent or more of slab vibration coupled into the DVIA‑MB1000.
At roughly 10 Hz with roughly −34.9 dB, attenuation performance stays roughly ninety‑eight percent or more versus slab vibration pickup.
X axis (Left to Right) VC Curve
At dominant low‑frequency vibration below roughly 10 Hz around 8 Hz, VC‑G at 4.48E‑07 m/s RMS on the DVIA‑MB1000 platform measures near VC‑G at 9.24E‑08 m/s RMS indicating attenuation. Above 10 Hz at about 13 Hz the site VC‑F at roughly 1.05E‑06 m/s RMS is attenuated toward VC‑G near 4.60E‑08 m/s RMS. Noise spikes near 50 Hz and 63 Hz appear while VC‑G is otherwise maintained elsewhere on the band.
Y axis (Front to Back) Transmissibility
At roughly 2 Hz below roughly 10 Hz, −24.5 dB corresponds to attenuation of roughly ninety‑four percent or more of slab‑side vibration coupling.
At roughly 10 Hz with roughly −34.1 dB, attenuation maintains roughly ninety‑eight percent or more versus slab pickup.
Y axis (Front to Back) VC Curve
Measured vibration stays at VC‑G both below roughly 10 Hz and above roughly 10 Hz across the plotted band summarized for this axis.
With VC‑G across all bands summarized, attenuation proceeds from roughly 6.72E‑07 m/s RMS at roughly 4 Hz on the slab to roughly 6.99E‑08 m/s RMS at roughly 4 Hz on top of the DVIA‑MB1000. Noise‑like spikes around 55 Hz and 60 Hz occur while VC‑G is otherwise recovered across the plotted band.
Transmissibility Graph
Accelerometers bonded to both the DVIA‑MB1000 top plate and the supporting floor slab wired through Data Physics QUATTRO hardware summarize transmissibility from roughly 1–100 Hz. Transmissibility is defined as dividing the RMS acceleration picked up atop the DVIA‑MB1000 by the RMS motion picked up on the supporting slab beneath the DVIA‑MB1000. Within the band roughly below 10 Hz the extremely small slab motion nearer VC‑G below roughly 1.5 Hz renders transmissibility look comparatively suppressed; nevertheless most other plotted bands summarize roughly seventy to ninety percent attenuation of slab vibration coupling. Electrical noise and equipment responses register spiked responses near fifty‑five Hz and sixty Hz on the X‑ and Z‑axis overlays. Turning the microscope fully off yields more precise tuning and vibration measurement results.
Installation Photo
Generic Vibration Criteria
| Criterion Curve | Description | Amplitude µm/s (µin/s) | Detail Size µm |
|---|---|---|---|
| Workshop (ISO) | Distinctly perceptible vibration. Appropriate to workshops and non-sensitive areas. | 800 (32,000) | N/A |
| Office (ISO) | Perceptible vibration. Appropriate to offices and non-sensitive areas. | 400 (16,000) | N/A |
| Residential Area (ISO) | Barely perceptible vibration. Appropriate to sleep areas in most instances. | 200 (8,000) | 75 |
| Operating Theatre (ISO) | Vibration not perceptible. Suitable for surgical suites, microscopes to 100x. | 100 (4,000) | 25 |
| VC-A | Adequate for optical microscopes to 400x, microbalances, optical balances. | 50 (2,000) | 8 |
| VC-B | Appropriate for inspection and lithography equipment to 3μm line widths. | 25 (1,000) | 3 |
| VC-C | Appropriate for optical microscopes to 1000x, lithography equipment to 1μm. | 12.5 (500) | 1 - 3 |
| VC-D | Suitable for demanding equipment including electron microscopes (SEMs/TEMs). | 6.25 (250) | 0.1 - 0.3 |
| VC-E | For the most demanding systems including E-Beam lithography at nanometer scales. | 3.12 (125) | < 0.1 |
| VC-F | For extremely quiet research spaces. Not recommended as design criterion. | 1.56 (62.5) | N/A |
| VC-G | For extremely quiet research spaces. Not recommended as design criterion. | 0.78 (31.25) | N/A |
Notes:
As measured in one-third octave bands over 8-80 Hz (VC-A/B) or 1-80 Hz (VC-C through VC-G).
Detail size refers to width in microelectronics fabrication or particle size in medical research.
Share this Case Study
Case Study Information
Related Case Studies
ZEISS Crossbeam 550 DVIA-MB1000 (221012R4) Installation Report

Tier-1 Semiconductor Hwaseong ZEISS GeminiSEM 460 DVIA-MB1000 (230110R2) Installation Report
