Tier-1 Semiconductor Suwon Nikon NSR-2205i12D DVIA-P7000 Inspection Report
Contents
Overview
Operation status inspection and vibration measurement were performed on the DVIA-P7000.
Inspection and vibration measurement were conducted with the equipment in IDLE state. (Equipment vibration typically occurs in the 10–30 Hz band.)
Overall performance appears reduced in the vibration measurement results, but comparing with graphs from the upper equipment Turn off state measured on 2023.04.14, upper vibration was measured higher due to equipment IDLE vibration.
System Information
Model: DVIA-P7000
Serial Number: 140416R6-1
Serial Number (SAC-07): 022469
Engineer
Youngha Lee, Jongwon Park from DAEIL SYSTEMS
Inspection Date
December 12, 2023
Report written date
December 18, 2023
Trip dates
Date of business trip : 17.12.27~17.12.29
Prepared for
Tier-1 Semiconductor
Location
SAIT Cleanroom Building A, Suwon
Equipment
Stepper NSR-2205i12D
Summary of Vibration Results
| Measurement Point | Z-axis (Vertical) 1–10 Hz | Z-axis (Vertical) 12.5–80 Hz | X-axis (Left to Right) 1–10 Hz | X-axis (Left to Right) 12.5–80 Hz | Y-axis (Front to Back) 1–10 Hz | Y-axis (Front to Back) 12.5–80 Hz |
|---|---|---|---|---|---|---|
| Floor | E | Operating Theatre (ISO) | D | Workshop (ISO) | E | Residential Area (ISO) |
| Active | D | A | D | B | D | Operating Theatre (ISO) |
Field Notes
When the equipment is in IDLE state, equipment vibration can occur in the 10–30 Hz band or high-frequency bands, and that vibration may be measured on the top plate.
Compared with data from the April 14, 2023 inspection, upper vibration is currently measured higher due to equipment IDLE vibration.
Complete Turn off of the upper equipment is required for accurate inspection and tuning of the vibration isolation platform.
Vibration Measurement
8.1) PULSE 22
Hardware: Bruel & Kjaer Type 3050-A-040
Software: LapShop Application(PULSE Lapshop)
8.2) Accelerometer
PCB Accelerometer
Model: 393B05
Data and Image
Accelerometer Sensor
Displacement Sensor
The accelerometer and displacement sensors correctly sense vibration changes and operate normally.
Z-axis (Vertical) Passive Transmissibility
In the Passive Transmissibility graph, the DVIA-P resonance peak below 10 Hz is output asymmetrically.
Resonance peaks from installation structure and utility exist at 10 Hz and in the 20–80 Hz band, and resonance peaks from equipment IDLE vibration are present.
In the Active Transmissibility graph, transmissibility above 0 dB in the 1–7 Hz band suggests vibration from installation structure, utility, and upper equipment IDLE vibration.
Multiple resonance peaks suspected from upper equipment IDLE vibration also exist in the remaining bands.
Z-axis (Vertical) Feedforward Transmissibility, FFT Vibration (Floor, Active)
X-axis (Left to Right) Passive Transmissibility
In the Passive Transmissibility graph, the DVIA-P resonance peak at 10 Hz is output in the correct form.
A large resonance peak in the 35–50 Hz band is suspected to be from installation structure or equipment IDLE vibration.
In the Active Transmissibility graph, poor performance with transmissibility above 0 dB in the 1–10 Hz band is suspected to be from installation structure, utility, or equipment IDLE vibration.
A resonance peak from equipment IDLE vibration appears at 50 Hz.
X-axis (Left to Right) Transmissibility, FFT Vibration (Floor, Active)
Y-axis (Front to Back) Passive Transmissibility
In the Passive Transmissibility graph, the DVIA-P resonance peak below 10 Hz is output in a blunt form.
Resonance peaks from equipment IDLE vibration exist at 17 Hz and in the 40 Hz and 70 Hz bands.
In the Active Transmissibility graph, somewhat poor performance with transmissibility greater than −10 dB at 10 Hz is suspected to be from installation structure and utility effects. Resonance peaks from equipment IDLE vibration appear at 40 Hz and 70 Hz.
In the remaining bands, transmissibility is −10 dB or better and isolation operates correctly.
Y-axis (Front to Back) Transmissibility, FFT Vibration (Floor, Active)
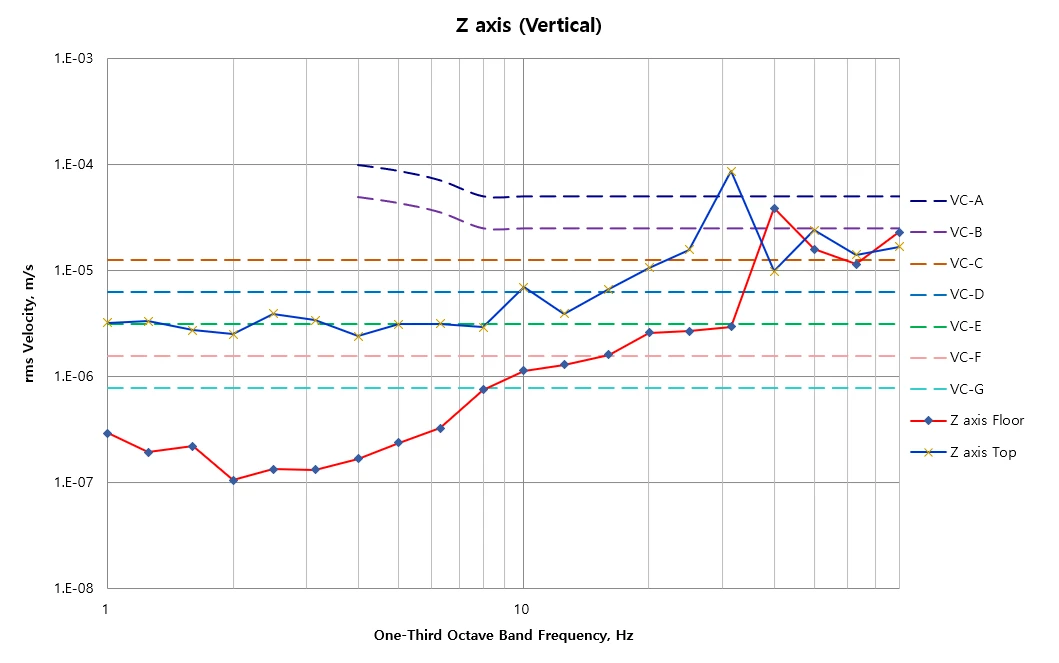
Z-axis (Vertical) VC curves
In the low-frequency band, vibration below VC-F is small and low damping is output due to proportional vibration characteristics, but the rise is large. This may be from equipment IDLE vibration or installation structure/utility environment.
In the graph above, vibration on the top plate is larger than the floor in the 10–60 Hz band; comparing with the Daeil UI Program Transmissibility graph, that vibration is suspected to be from upper equipment IDLE vibration.
Z-axis (Vertical) VC curves (23.04.14 측정 장비 Off 상태)
According to the April 2023 vibration measurement with equipment Turn off, correct isolation is confirmed in the 4–60 Hz band.
Therefore, the amplified VC curve measured on 23.12.12 can be judged to be influenced by equipment IDLE vibration.
X-axis (Left to Right) VC curves
In the low-frequency band, vibration below VC-F is small and low damping is output due to proportional vibration characteristics.
Performance is somewhat poor up to the 10 Hz band, but good performance is output thereafter.
X-axis (Left to Right) VC curves (23.04.14 측정 장비 Off 상태)
According to the April 2023 vibration measurement with equipment Turn off, correct isolation is confirmed in the 4–60 Hz band.
Therefore, the amplified VC curve measured on 23.12.12 can be judged to be influenced by equipment IDLE vibration.
Y-axis (Front to Back) VC curves
In the low-frequency band, vibration below VC-F is small and low damping is output due to proportional vibration characteristics, but the rise is large. This may be from equipment vibration or installation structure/utility environment.
At the 50 Hz band, vibration on the top plate is larger than the floor; comparing with the Daeil UI Program Transmissibility graph, that vibration is suspected to be from upper equipment IDLE vibration.
Y-axis (Front to Back) VC curves (23.04.14 측정 장비 Off 상태)
According to the April 2023 vibration measurement with equipment Turn off, correct isolation is confirmed in the 4–60 Hz band.
Therefore, the amplified VC curve measured on 23.12.12 can be judged to be influenced by equipment IDLE vibration.
Reference
Generic Vibration Criteria
Notes:
1. VC-A/B is measured in 1/3 octave bands from 8-80 Hz, VC-C through VC-G from 1-80 Hz.
2. Detail size refers to line widths in microelectronics manufacturing or particle sizes in medical research.
Share this Case Study
Case Study Information
Related Case Studies

Tier-1 Semiconductor Giheung SIX-3001 DVIA-P7000 Installation Report

Tier-1 Semiconductor Icheon Applied Materials PROVision 10 DVIA-P7000 Installation Report