원익 IPS DVIA-T78(211213R1) 설치 보고서
Contents
엔지니어
엔지니어: 박동규
측정 날짜
2025년 11월 25일
보고서 작성일
2025년 11월 27일
개요
원익 IPS 진위 사업장 4F wafer 분석실에 설치된 T78의 튜닝 및 진동측정 진행하였습니다.
장비 설치 및 Turned on/IDLE 상태로 튜닝 및 진동측정 진행하였습니다.
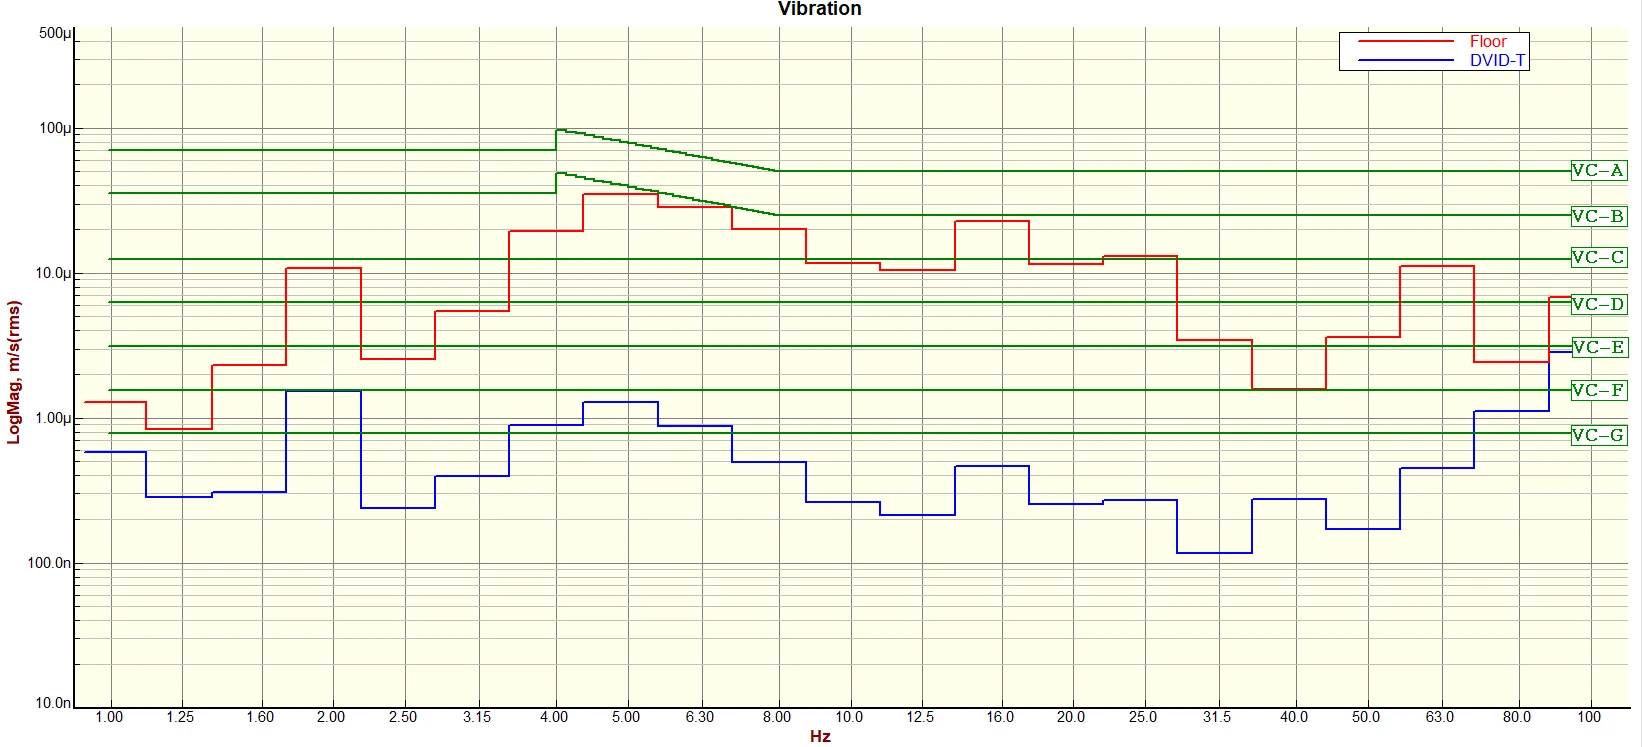
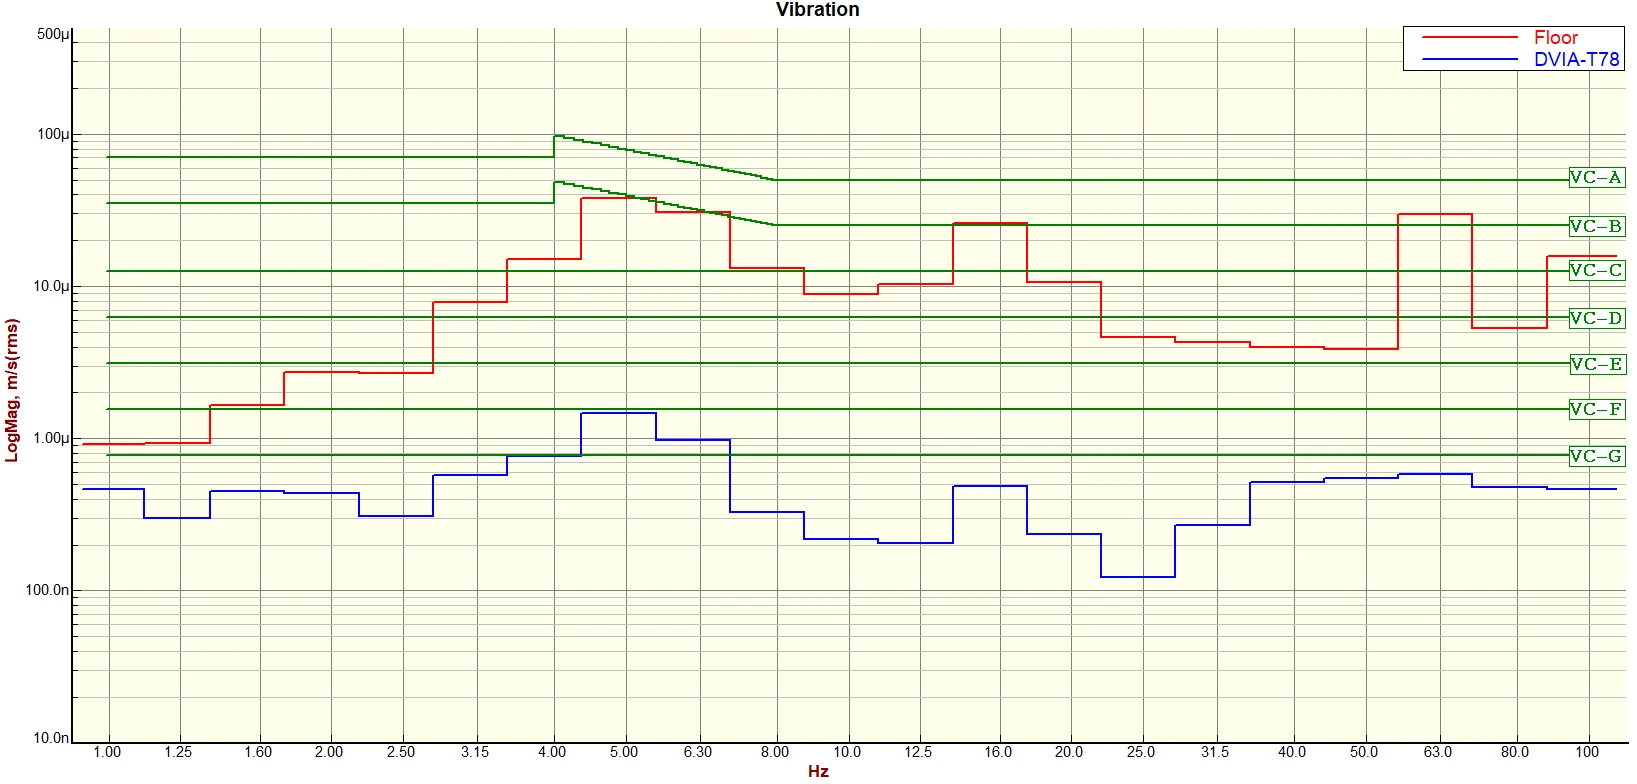
T78의 상판과 바닥의 진동 측정 한번, T78위에 장비내 바닥 진동측정 한번 하여 총 두번의 진동측정을 진행하였습니다.
Data를 VC Curve로 표기 후 진동 수준에 대한 Reference 자료를 제공합니다.
제진대
모델: DVIA-T78
시리얼 넘버: 211213R1
필드 엔지니어
대일시스템 개발팀 박동규
설치 장소
원익 IPS 진위 사업장 4F wafer 분석실
End User
원익 IPS
고객사 장비
Manufacturer: BRUKER
Equipment: Nano Indentation tester
Model: TS77
장비 스펙
VC-C
장비상태
장비 설치 및 Turned on/IDLE
진동 측정 장비
10.1) Brüel & Kjær LAN-XI DAQ Type 3050 DAQ
-Hardware: B&K Front End Type 3050-A-040
-Software: B&K Pulse Labshop 22 Version
10.2) Accelerometer
PCB Accelerometer
Model: 393B05
진동 측정 Setup
Bandwidth: 200 Hz
Lines: 3200
Averaging: Spectrum Averaging
Engineering Units: m/s
Window: Hanning
Overlap: Max
결론
DVIA-T78은 모든 방향에서 스펙을 만족합니다.
바닥 진동은 Vertical 축의 Spec out을 제외하면 모든 방향에서는 스펙을 만족 합니다.
장비 바닥의 진동도 모든 방향에서 스펙을 만족합니다.
측정 데이터
13.1) 측정데이터 1
| 측정 장소 | 상태 | 방향 | 바닥진동 | DVIA-T78 | 바닥진동 | DVIA-T78 |
|---|---|---|---|---|---|---|
| 원익 IPS 진위 사업장 4F wafer 분석실 1. 바닥진동 2. DVIA-T78 | Turned on/IDLE | Vertical | VC-B @ 6 Hz | VC-E @ 70 Hz | ✗ Fail | ✓ Pass |
| Left to Right | VC-D @ 3 Hz | VC-G @ 1 Hz | ✓ Pass | ✓ Pass | ||
| Front to Back | VC-D @ 3 Hz | VC-G @ 70 Hz | ✓ Pass | ✓ Pass |
13.2) 측정데이터 2
| 측정 장소 | 상태 | 방향 | 측정값 |
|---|---|---|---|
| 장비바닥진동 | |||
| 원익 IPS 진위 사업장 4F wafer 분석실 1. 장비 바닥진동 | Turned on/IDLE | Vertical | VC-F @ 2 Hz |
| Left to Right | VC-F @ 10 Hz | ||
| Front to Back | VC-E @ 10 Hz |
데이터&이미지
14.1) 측정 데이터1
Vertical VC Curves (Red: 바닥 진동, Blue: DVIA-T78)
Vertical Autospectrum (Red: 바닥 진동, Blue: DVIA-T78)
Vertical Transmissibility (Red: 바닥 진동, Blue: DVIA-T78)
Left to Right VC Curves (Red: 바닥 진동, Blue: DVIA-T78)
Left to Right Autospectrum (Red: 바닥 진동, Blue: DVIA-T78)
Left to Right Transmissibility (Red: 바닥 진동, Blue: DVIA-T78)
Front to Back VC Curves (Red: 바닥 진동, Blue: DVIA-T78)
Front to Back Autospectrum (Red: 바닥 진동, Blue: DVIA-T78)
Front to Back Transmissibility (Red: 바닥 진동, Blue: DVIA-T78)
14.2) 측정데이터& 이미지 2
Vertical VC Curves (Red: 장비 바닥 진동)
Vertical Autospectrum (Red: 장비 바닥 진동)
Left to Right VC Curves (Red: 장비 바닥 진동)
Left to Right Autospectrum (Red: 장비 바닥 진동)
Front to Back VC Curves (Red: 장비 바닥 진동)
Front to Back Autospectrum (Red: 장비 바닥 진동)
참고자료
참고:
1. VC-A/B는 8–80 Hz 1/3 옥타브 밴드로 측정하고, VC-C부터 VC-G는 1–80 Hz에서 측정합니다.
2. Detail size는 전자 장비 제조 공정에서의 라인폭 또는 의학 연구에서의 입자 크기를 의미합니다.