Techsand Photomask CLB ZEISS MeRiT MG neo DVIA-P2200 Installation Report
Contents
Overview
Tuning and vibration measurement were performed on the DVIA-P2200 installed at Techsand Photomask CLB.
Tuning and vibration measurement were conducted to verify whether vibration specifications are satisfied before equipment installation.
Data are presented as VC Curves, along with reference materials for vibration level assessment.
Vibration Isolation System Information
Model: DVIA-P2200
Serial Number: 250626R1
Engineer
Chaewon Lee from DAEIL SYSTEMS
Measurement Date
September 17, 2025
End User
Techsand Photomask
Installation Site
Techsand Photomask
Equipment Status
Equipment not installed
Equipment Information
Manufacturer: ZEISS
Equipment: X-ray Microscope
Model: MeRiT® MG neo
Measuring Equipment
9.1) Data Physics DAQ
- Hardware: QUATTRO, Serial Number: 22436
- Software: SignalCalc ACE
9.2) Accelerometer
- PCB Accelerometer
- Model: 393B05
Measuring Set-up
F Span: 1250 Hz
Lines: 3200
Engineering Units: m/s
Window: Hanning
Averaging: FFT Spectrum Averaging
Averaging mode: Exponential, 40
Equipment Vibration Specification
Conclusion
The specification is satisfied in all directions.
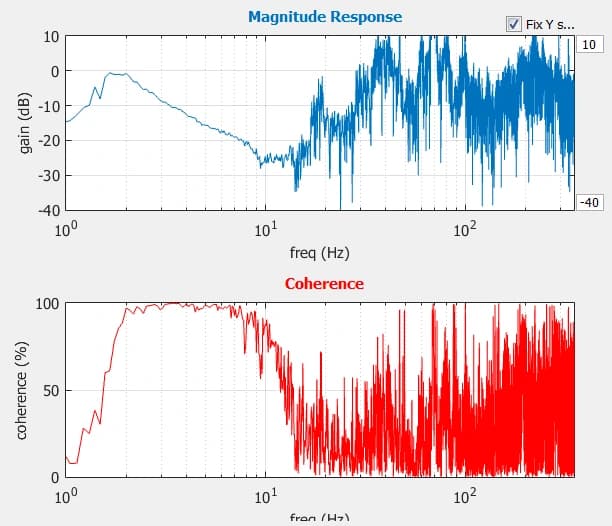
In the vertical direction, in the 200–250 Hz band, vibration on top of the isolator was measured somewhat higher than floor vibration. This is judged to be a structural flexible mode of the upper pad and plate under no-load conditions (equipment not installed). When the actual equipment is installed on top, this natural mode is expected to be damped by the mass load and not to affect isolation performance.
Measurement Data
| Measuring Point | Status | Direction | Spec | Measurement Data | Result | ||
|---|---|---|---|---|---|---|---|
| Floor | DVIA-P2200 | Floor | DVIA-P2200 | ||||
| Techsand Photomask CLB 1. Floor Vibration 2. DVIA-P2200 | Equipment not installed | Vertical | VC-D | VC-D @ 50 Hz | VC-G @ 1 Hz | ✓ PASS | ✓ PASS |
| Left to Right | VC-D @ 16 Hz | VC-F @ 16 Hz | ✓ PASS | ✓ PASS | |||
| Front to Back | VC-C @ 16 Hz | VC-G @ 16 Hz | ✗ FAIL | ✓ PASS | |||
Data and Image
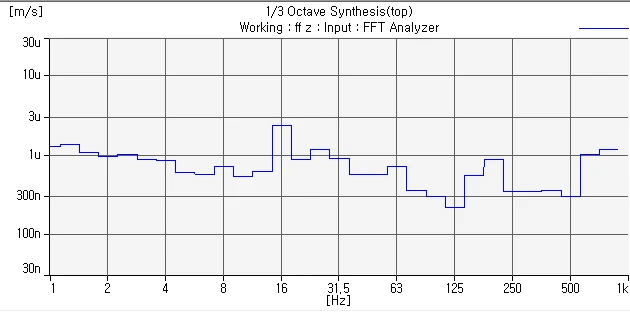
Vertical VC Curves
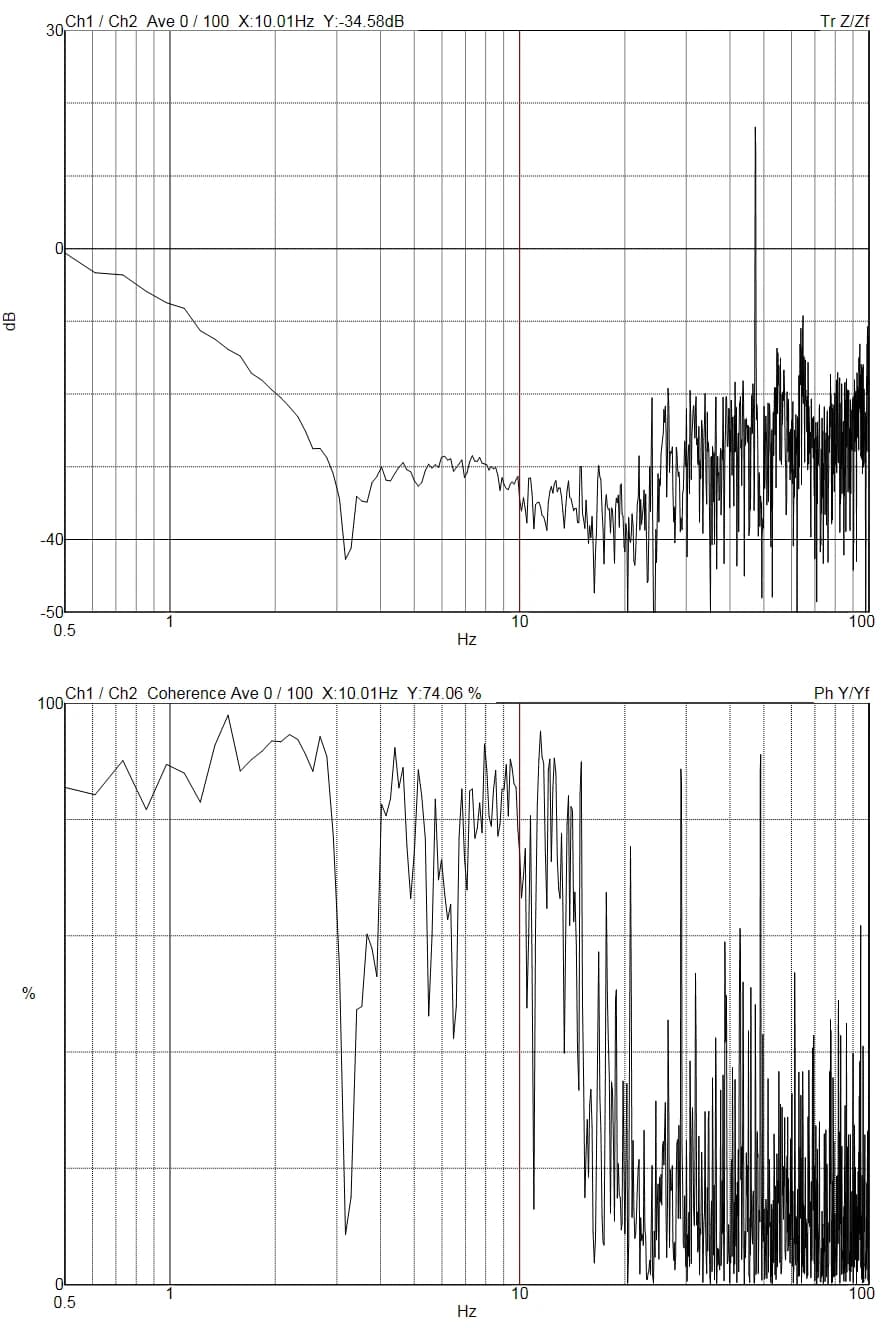
Vertical Transmissibility
Left to Right VC Curves
Left to Right Transmissibility
Front to Back VC Curves
Front to Back Transmissibility
Reference
VC / ISO vibration criteria
Notes:
1. VC-A/B is measured in 1/3 octave bands from 8-80 Hz, VC-C through VC-G from 1-80 Hz.
2. Detail size refers to line widths in microelectronics manufacturing or particle sizes in medical research.