Youngwoo DSP Cheonan DVIA-P2200 (230927R5) Installation Report
Contents
Overview
Vibration measurement was performed at Youngwoo DSP (Cheonan) with the equipment on top of the isolator in Turn on state.
Vibration measurement results are presented as VC curves together with reference materials on vibration levels.
Engineer
Jeong Seongyun from DAEIL SYSTEMS
Measurement Date
September 30, 2024
Installation Site
Youngwoo DSP Cheonan headquarters factory
Measuring Equipment
5.1) Brüel & Kjær LAN-XI DAQ Type 3050
Hardware: B&K Front End Type 3050-A-040
Software: B&K Pulse Labshop 22 Version
5.2) Accelerometer
PCB Accelerometer
Model: 393B05
Measuring Set-up
F Span: 200
Lines: 800
Window: Hanning
Averaging: FFT Spectrum Averaging
Engineering Units: m/s2
Vibration Specifications
Undetermined
Conclusion
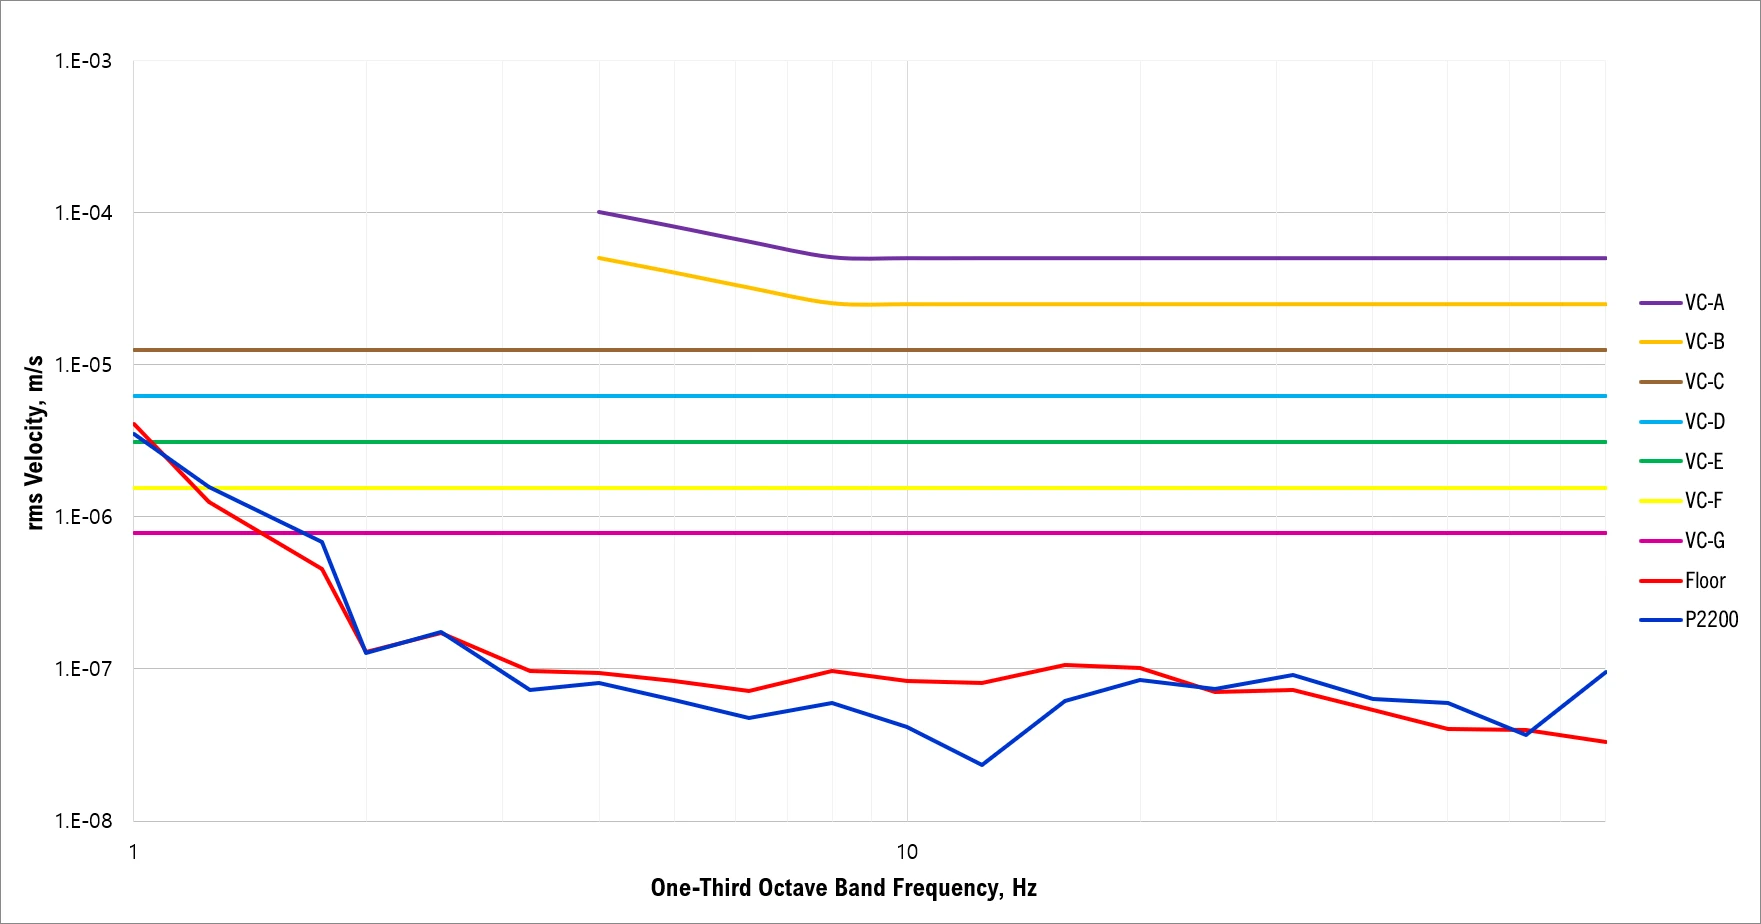
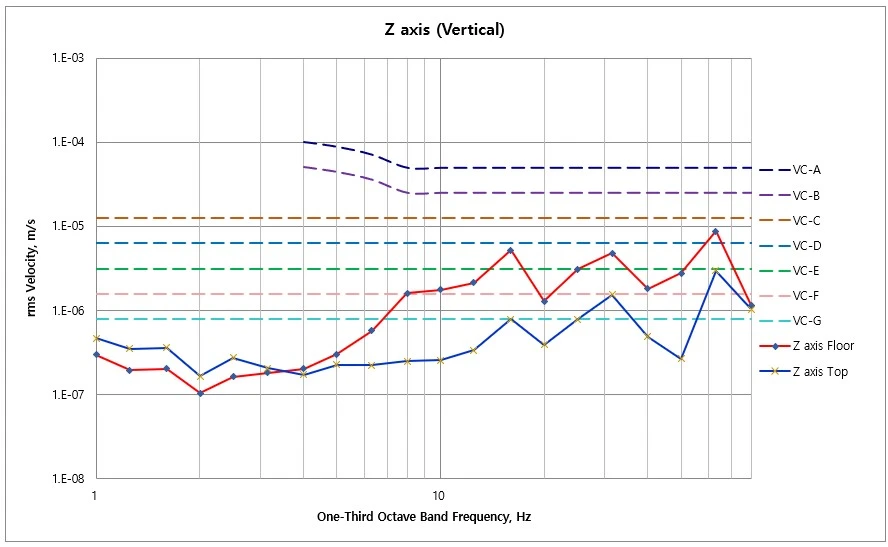
When customer equipment is Turn On, maximum VC-C floor vibration is measured.
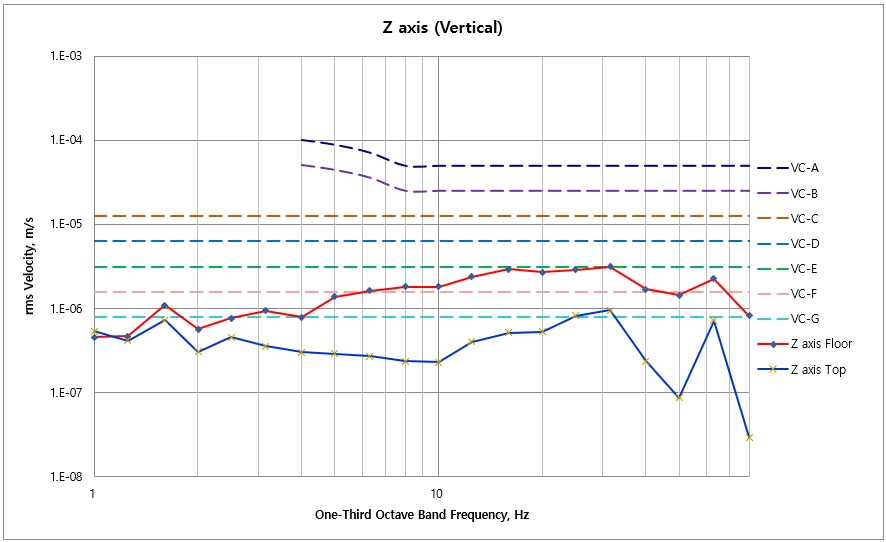
When the isolator is Active On, DVIA-P2200 top-plate vibration is VC-G or below in all three directions.
Upper equipment is customer-built; vibration specification is not yet defined.
Measurement Data
| Measuring Point | Direction | Vibration Spec. | Measurement value |
|---|---|---|---|
| DVIA-P2200 | Vertical (Z) | Undetermined | VC-G |
| Left to right (X) | VC-G | ||
| Front to back (Y) | VC-G | ||
| Floor | Vertical (Z) | VC-E | |
| Left to right (X) | VC-C | ||
| Front to back (Y) | VC-D |
Data and Image
Vertical Autospectrum
Vertical Transmissibility
Vertical VC Curves
Left to Right Autospectrum and Transmissibility
Left to Right VC Curves
Front to Back Autospectrum and Transmissibility
Front to Back VC Curves
Reference
Generic Vibration Criteria
Notes:
1. VC-A/B is measured in 1/3 octave bands from 8-80 Hz, VC-C through VC-G from 1-80 Hz.
2. Detail size refers to line widths in microelectronics manufacturing or particle sizes in medical research.