Samsung Electro-Mechanics Suwon FCB PST DVIA-P2200 Installation Report
Contents
Overview
Installation tuning and vibration measurement were performed on the DVIA-P2200 at the Samsung Electro-Mechanics Suwon site (relocation to the Busan site is planned later).
Inspection and vibration measurement were conducted with the equipment in IDLE state (equipment vibration in the 10–30 Hz band is normally present but was very small in IDLE during this measurement).
Although floor vibration was low, performance was favorable on the X, Y, and Z axes; the active measurement side reached VC-G class.
System Information
Model: DVIC-P2200-1500x1300x1415H
Serial Number: 230417R6
Engineer
Youngha Lee, Jongwon Park from DAEIL SYSTEMS
Date of business trip: 17.12.27~17.12.29
Report written date: 24.01.03
Inspection Date
December 29, 2023
Location
삼성전기 B1동, Suwon
End User
Samsung Electro-Mechanics
Equipment
삼성전기 기판검사기 FCB PST
Summary of Vibration Results
Floor reference — measured on floor (바닥)
| Measurement Point | Z-axis (Vertical) 1-10 Hz | Z-axis (Vertical) 12.5-80 Hz | X-axis (Left to Right) 1-10 Hz | X-axis (Left to Right) 12.5-80 Hz | Y-axis (Front to Back) 1-10 Hz | Y-axis (Front to Back) 12.5-80 Hz |
|---|---|---|---|---|---|---|
| Floor | G | F | G | G | F | E |
| Active | G | G | G | G | G | G |
At all frequency bands, ground vibration was attenuated and the active measurement side showed VC-G.
Floor reference — measured on frame
| Measurement Point | Z-axis (Vertical) 1-10 Hz | Z-axis (Vertical) 12.5-80 Hz | X-axis (Left to Right) 1-10 Hz | X-axis (Left to Right) 12.5-80 Hz | Y-axis (Front to Back) 1-10 Hz | Y-axis (Front to Back) 12.5-80 Hz |
|---|---|---|---|---|---|---|
| Floor | G | D | G | C | F | C |
| Active | G | G | G | G | G | G |
At all frequency bands, ground vibration was attenuated and the active measurement side showed VC-G.
Vibration Measurement
PULSE 22
Hardware: Bruel & Kjaer Type 3050-A-040
Software: LapShop Application(PULSE Lapshop)
Accelerometer
PCB Accelerometer
Model: 393B05
Data and Image
Accelerometer Sensor
Displacement Sensor
Accelerometer and displacement sensors sense vibration changes correctly and operate normally.
Z-axis (Vertical) Passive Transmissibility
Z-axis (Vertical) Feedforward Transmissibility, FFT Vibration (Floor, Active)
On the passive transmissibility graph, the DVIA-P resonance peak is correctly shown at 5 Hz.
Peak vibration near 50 Hz was measured but attenuated by about -10 dB.
On the active transmissibility graph, isolation is correct at about -10 dB or better near 2 Hz.
Peak vibration near 50 Hz was measured but attenuated by about -10 dB.
X-axis (Left to Right) Passive Transmissibility
X-axis (Left to Right) Transmissibility, FFT Vibration (Floor, Active)
On the passive transmissibility graph, the DVIA-P resonance peaks are correctly shown at 5 and 9 Hz.
Peak vibration near 50 Hz was measured but attenuated by about -10 dB.
On the active transmissibility graph, isolation is correct at about -10 dB or better in the 2–3 Hz band.
A resonance near 25 Hz is present but below -10 dB.
Y-axis (Front to Back) Passive Transmissibility
Y-axis (Front to Back) Transmissibility, FFT Vibration (Floor, Active)
On the passive transmissibility graph, the DVIA-P resonance peaks are correctly shown at 4 and 8 Hz.
On the active transmissibility graph, isolation is correct at about -10 dB or better near 4 Hz.
A resonance near 22 Hz is present but below -10 dB.
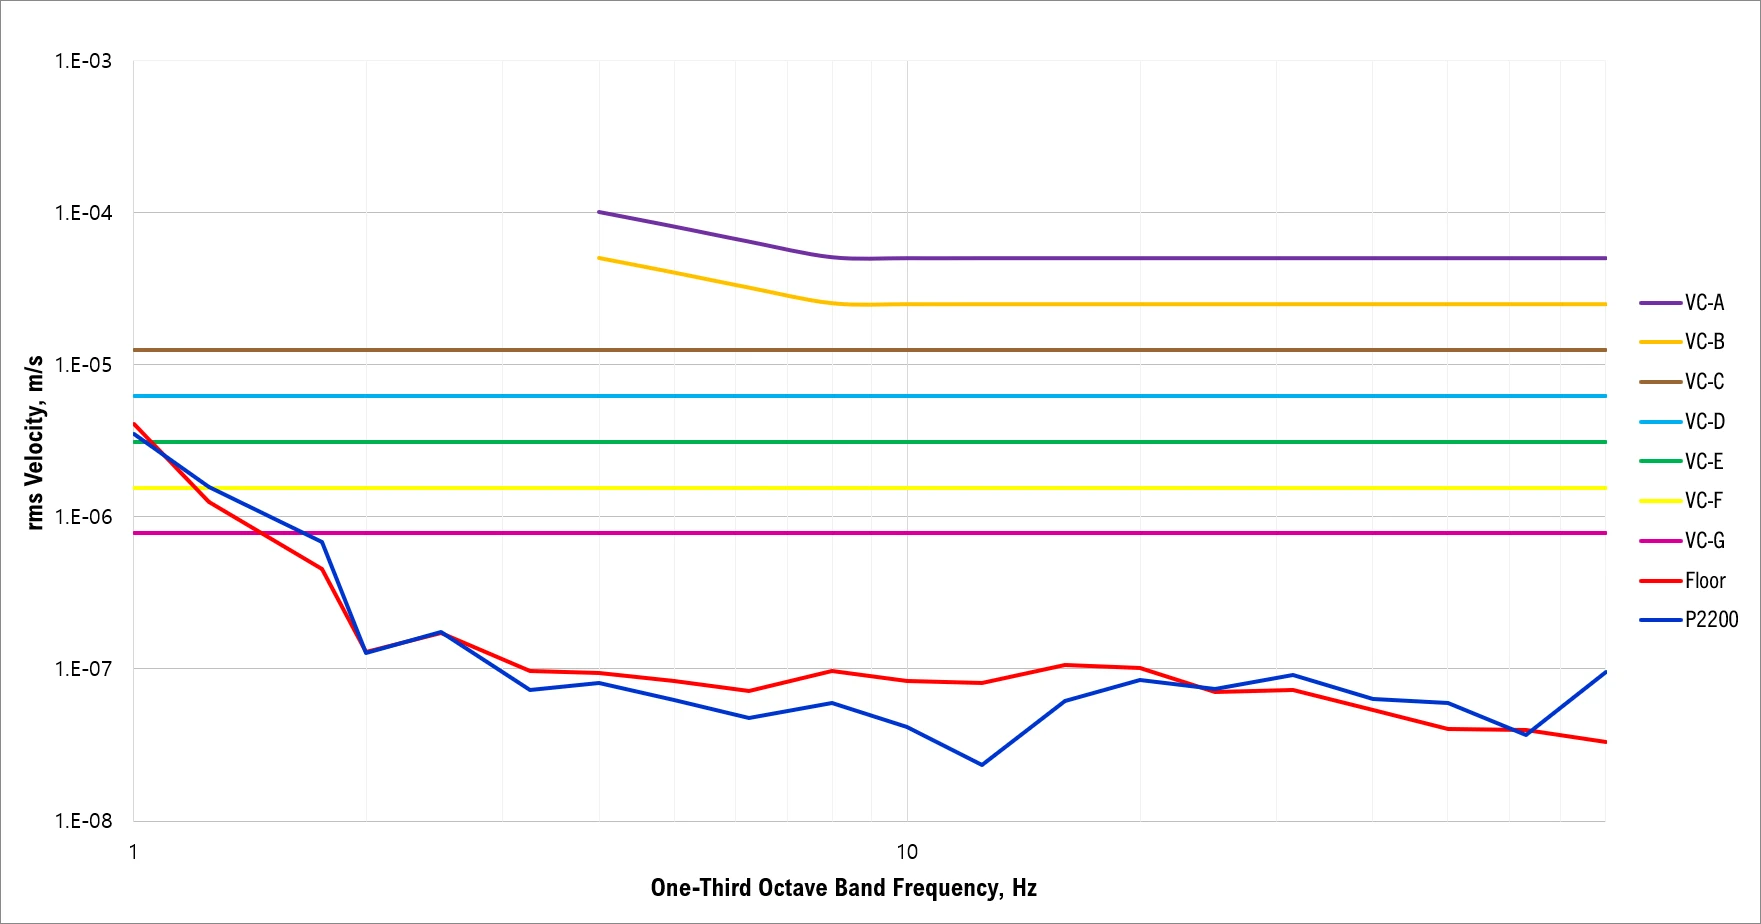
Z-axis (Vertical) VC curves (Floor: 바닥)
The floor sensor was placed on the installation-site floor. Floor vibration stayed very low at VC-G through about 25 Hz and increased to VC-F near 30 Hz.
The top sensor was placed on the stone table on the isolator. In the 1–10 Hz band, vibration was below VC-G, so proportional damping shows a lower attenuation ratio; vibration at or below VC-G was measured in all bands.
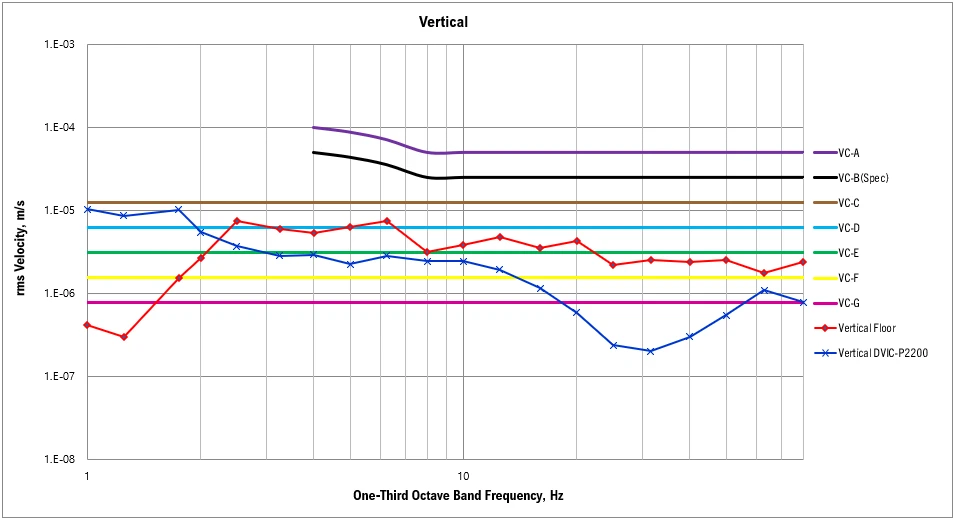
Z-axis (Vertical) VC curves (Floor: Frame)
The floor sensor was placed on the isolator lower frame. Floor vibration stayed very low at VC-G through about 20 Hz, increased to VC-F near 30 Hz and VC-D near 50 Hz (utility or sub-equipment connected to the lower frame).
The top sensor was placed on the stone table on the isolator; as in the graph above, vibration at or below VC-G was measured in all bands.
X-axis (Left to Right) VC curves (Floor: 바닥)
The floor sensor was placed on the installation-site floor. Floor vibration stayed very low at VC-G through about 25 Hz and increased to VC-F near 30 Hz.
The top sensor was placed on the stone table on the isolator. In the 1–10 Hz band, vibration was below VC-G; vibration at or below VC-G was measured in all bands.
X-axis (Left to Right) VC curves (Floor: Frame)
The floor sensor was placed on the isolator lower frame. Floor vibration stayed very low at VC-G through about 20 Hz, increased to VC-E near 30 Hz and VC-C near 50 Hz (utility or sub-equipment on the lower frame).
The top sensor was placed on the stone table on the isolator; vibration at or below VC-G was measured in all bands. Lower attenuation near 10 Hz is judged as momentary vibration compared with the floor-reference graph.
Y-axis (Front to Back) VC curves (Floor: 바닥)
The floor sensor was placed on the installation-site floor. Floor vibration stayed very low at VC-G through about 8 Hz but increased to VC-E between 10 and 13 Hz.
The top sensor was placed on the stone table on the isolator. In the 1–10 Hz band, vibration was below VC-G; vibration at or below VC-G was measured in all bands.
Y-axis (Front to Back) VC curves (Floor: Frame)
The floor sensor was placed on the isolator lower frame. Floor vibration stayed very low at VC-G through about 8 Hz, increased to VC-F near 10 Hz and VC-C near 50 Hz (utility or sub-equipment on the lower frame).
The top sensor was placed on the stone table on the isolator; vibration at or below VC-G was measured in all bands.
Reference
Generic Vibration Criteria
Notes:
1. VC-A/B is measured in 1/3 octave bands from 8-80 Hz, VC-C through VC-G from 1-80 Hz.
2. Detail size refers to line widths in microelectronics manufacturing or particle sizes in medical research.
Share this Case Study
Case Study Information
Related Case Studies
Samsung Electro Busan FCB PSP DVIA-P2200 (230417R6) Installation Report — 2024-04-17
Samsung Electro-Mechanics Suwon facility vibration environment measurement — 2017-07-05