Chan Zuckerberg Imaging Institute MB1000 Helios/Hydra Installation Report (2024-03-07)
Contents
Introduction
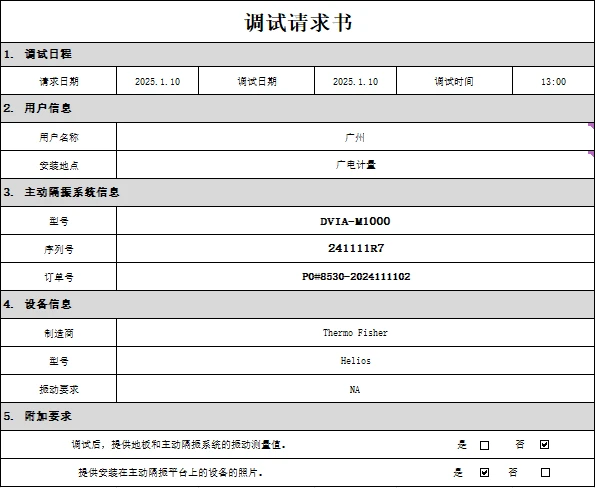
This report provides the details of the installation of the MB1000 for the TFS Helios/Hydra at 3400 Bridge Parkway, Redwood City, CA 94065. Chan Zuckerberg Imaging Institute hired VEC to install the vibration isolation system and provide a report of the completed work.
Summary Results
Below is a summary of the results:
MB1000 ON PASSED the Vibration specifications
Product Details
| Part Delivered | Serial Number | Software |
|---|---|---|
| MB1000 | 240110R3 | Site-specific Tune |
Summary of Work
We installed the system by
Positioning the daeil under the microscope
Leveling the daeil to within .5mm
Attaching seismic restraints between the floor and the daeil
Connecting the seismic restraints between the daeil and the tool
We tested the system by
Creating and uploading a site specific tune
Collecting vibration data to verify the performance
We left the system
In position and on
Procedures
Vibration
VEC conducted vibration measurements in three directions. Acceleration measurements were taken at a bandwidth of 250Hz with units of G (RMS). The acceleration spectra with 250Hz bandwidths were recorded.
Setup
| Vibration | |
|---|---|
| Bandwidth | 250Hz |
| Lines | 3200 |
| Window | Hanning |
| Coupling | ICP 2mA |
| Average Type | Stable |
| Duration | 60 seconds |
| Engineering Units | G (RMS) |
Data
Figure 1: Vibration (Z-Axis - Floor)
Figure 2: Vibration (Z-Axis - Table)
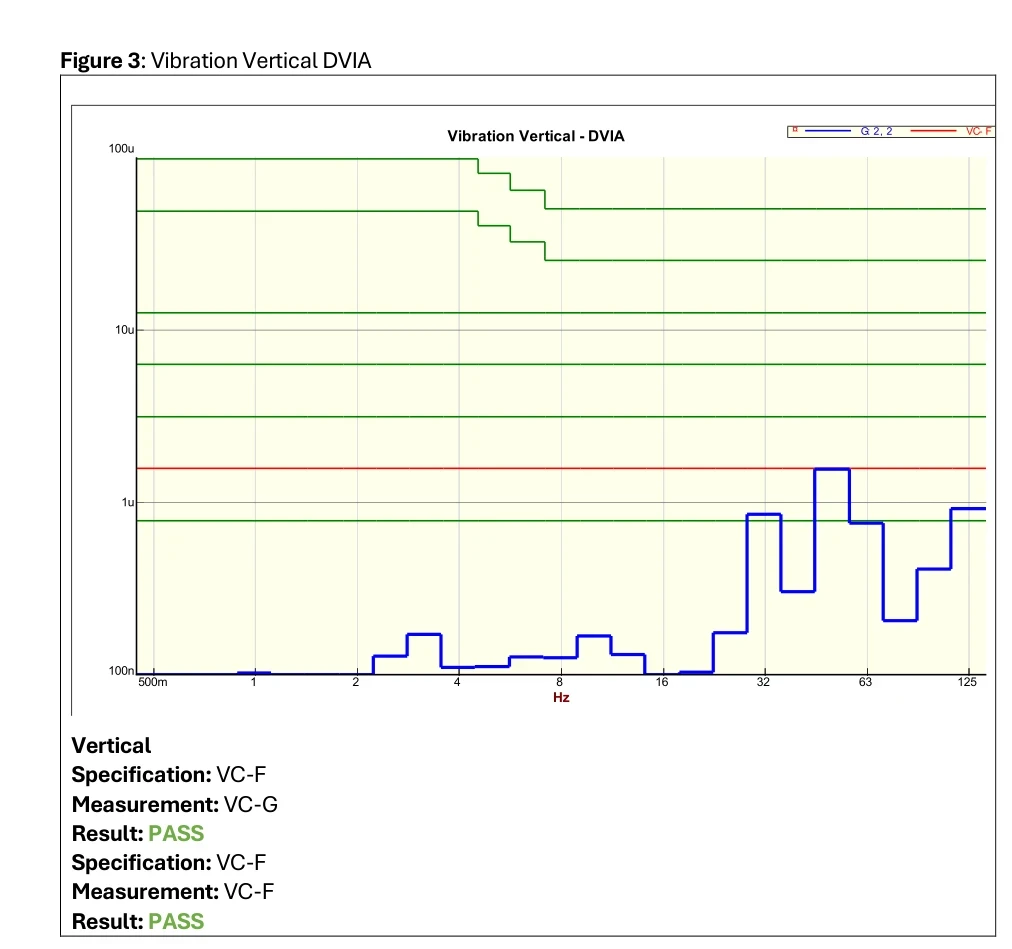
Figure 3: Vibration (Z-Axis – Floor, Table and Specification)
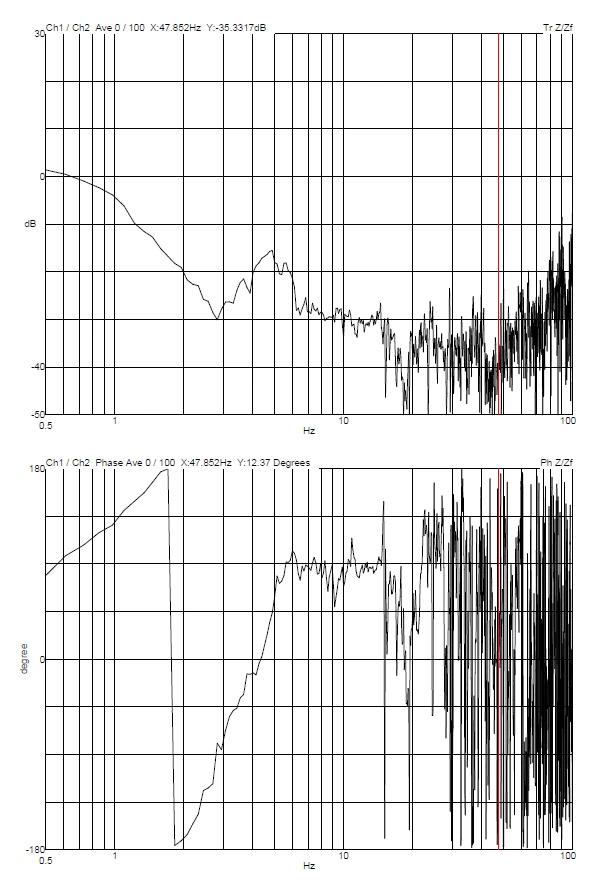
Figure 4: Vibration (Z-Axis - Transmissibility)
Figure 5: Vibration (Y-Axis - Floor)
Figure 6: Vibration (Y-Axis - Table)
Figure 7: Vibration (Y-Axis – Floor, Table and Specification)
Figure 8: Vibration (Y-Axis - Transmissibility)
Figure 9: Vibration (X-Axis - Floor)
Figure 10: Vibration (X-Axis - Table)
Figure 11: Vibration (X-Axis – Floor, Table and Specification)
Figure 12: Vibration (X-Axis - Transmissibility)
Figure 13: Room (View 1)
Figure 14: Room (View 2)
Figure 15: Microscope (View 1)
Figure 16: Microscope (View 2)
Figure 17: Microscope (View 3)
Reference
Notes:
1. As measured in one-third octave bands over 8-80 Hz (VC-A/B) or 1-80 Hz (VC-C through VC-G).
2. Detail size refers to width in microelectronics fabrication or particle size in medical research.
Share this Case Study
Case Study Information
Related Case Studies
Thermo Fisher Scientific TFS Helios (Brigham Young University) DVIA-ML1000 (250708R4-3) Installation Report
Thermo Fisher Scientific FIB-SEM Helios DVIA-M1000 (241111R7) Installation Report