Seohan Technology Research Institute JEOL JSM-IT500 DVIA-M1000 Installation Report — 2024.12.04
Contents
Prepared for
Seohan Technology Research Institute
Prepared by
Engineer: Chaewon Lee
Tuning date: 24.12.04
Report written date: 24.12.05
Overview
Tuning and vibration measurement were performed for the DVIA-M1000 relocated and installed at the Seohan Technology Research Institute — 3F materials testing laboratory.
After the equipment was landed, vibration measurement and tuning were carried out with the equipment in the Turned off state.
Data are presented as VC curves, and reference material on vibration levels is provided.
Vibration Isolation System Information
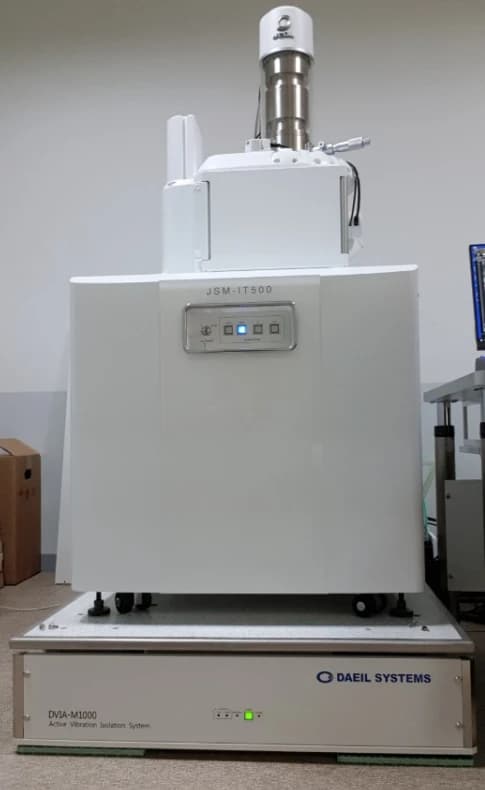
Model: DVIA-M1000
Serial Number: 171009R1
Engineer
Chaewon Lee, Field Engineer, DAEIL SYSTEMS
Tuning Date
December 4, 2024
Installation Site
Seohan Technology Research Institute — 3F materials testing laboratory
Equipment Status
Equipment installed and IDLE
Customer Equipment
Manufacturer: JEOL
Equipment: SEM
Model: JSM-IT500
Measurement Device
8.1) Data Physics DAQ
Hardware: QUATTRO, Serial Number: 22436
Software: SignalCalc ACE
8.2) Accelerometer
PCB Accelerometer
Model: 393B05
Measurement Setup
F Span: 200 Hz
Lines: 3200
Engineering Units: m/s
Window: Hanning
Averaging: FFT Spectrum Averaging
Averaging mode: Exponential, 40
Equipment Vibration Specification
2um (PkPk)
Conclusion
All directions meet the vibration specification.
Measurement Summary
| Measurement site | State | Vibration spec | Direction | Measured value (PkPk) Floor | Measured value (PkPk) DVIA-M1000 | Result Floor | Result DVIA-M1000 |
|---|---|---|---|---|---|---|---|
| Seohan Technology Research Institute 3F, materials testing laboratory | Equipment installed and IDLE | 2um (PkPk) | Vertical | 0.48 um @ 9.38 Hz | 0.043 um @ 9.38 Hz | ✓ PASS | ✓ PASS |
| Left to Right | 1.10 um @ 1.88 Hz | 0.077 um @ 1.88 Hz | ✓ PASS | ✓ PASS | |||
| Front to Back | 2.50 um @ 1.69 Hz | 0.3 um @ 1.69 Hz | ✗ FAIL | ✓ PASS |
Data and Image
Vertical VC Curves
Vertical Autospectrum
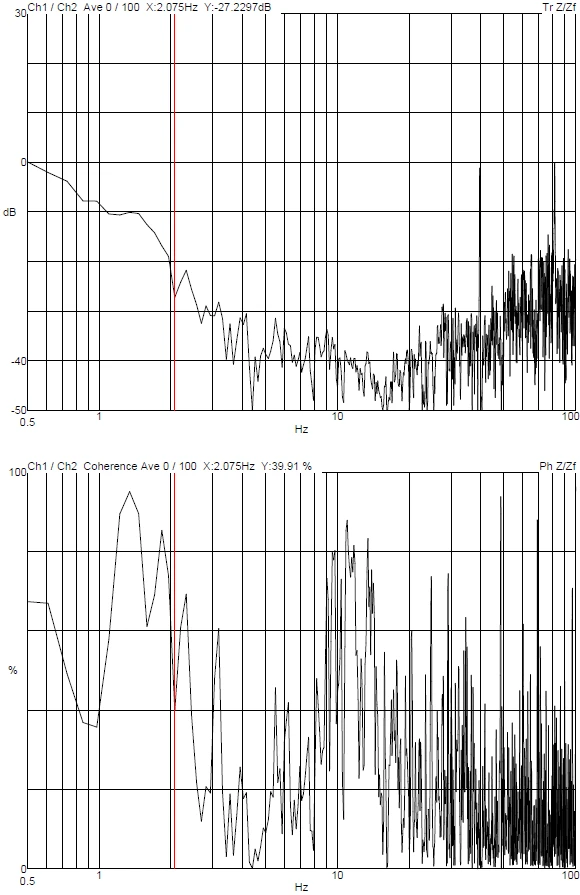
Vertical Transmissibility
Left to Right VC Curves
Left to Right Autospectrum
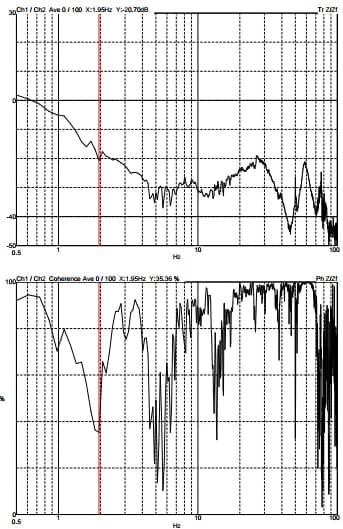
Left to Right Transmissibility
Front to Back VC Curves
Front to Back Autospecturm
Front to Back Transmissibility
Equipment Photo
Reference
Notes:
1. As measured in one-third octave bands over 8-80 Hz (VC-A/B) or 1-80 Hz (VC-C through VC-G).
2. Detail size refers to width in microelectronics fabrication or particle size in medical research.
Share this Case Study
Case Study Information
Related Case Studies
FIBERHOME JEOL JSM-IT500 DVIA-MB1000 Installation Report — onsite measurement (SN 190423R1, 2019-12-03)
Seohan Technology Research Institute JEOL JSM-IT500 DVIA-MB1000 (P54) Installation Report — 2018.01.02