Olympus OLS4100 DVIA-T67 (170718R8) Tier-1 Semiconductor Cheongju Installation Report — November 2025
Contents
Customer
LNSTECH (엘앤에스텍)
Author
Engineer: Chaewon Lee
Report Written Date
November 11, 2025
Overview
Inspection and vibration measurement were performed on the DVIA-T67 installed at Tier-1 Semiconductor Cheongju campus P&T6 4th-floor cleanroom K16.
Tuning and vibration measurement proceeded with the equipment installed and Turned on/IDLE.
Data are expressed as VC curves, and Reference information on vibration levels is provided.
Vibration Isolation Platform
Model: DVIA-T67
Serial number: 170718R8
Engineer
Chaewon Lee from DAEIL SYSTEMS, field engineer
Tuning Date
November 3, 2025
Installation Site
Tier-1 Semiconductor Cheongju campus P&T6 4th-floor cleanroom K16
End User
Tier-1 Semiconductor
Customer Equipment
Manufacturer: Olympus
Equipment: 3D Measuring Razer Microscope
Model: OLS4100
Equipment Specification
-
Equipment Status
Equipment installed and Turned on/IDLE
Measuring Equipment
10.1) Data Physics DAQ
-Hardware: QUATTRO, Serial Number: 22436
-Software: SignalCalc ACE
10.2) Accelerometer
PCB Accelerometer
Model: 393B05
Vibration Measurement Setup
F Span: 200 Hz
Lines: 3200
Engineering Units: m/s
Window: Hanning
Averaging: FFT Spectrum Averaging
Averaging mode: Exponential, 40
Conclusion
Across all directions, approximately 90% vibration isolation performance is observed in the 2–10 Hz band, and 95% or more isolation appears beyond 10 Hz.
Measurement Data
| Measurement site | State | Direction | Floor vibration | DVIA-T67 |
|---|---|---|---|---|
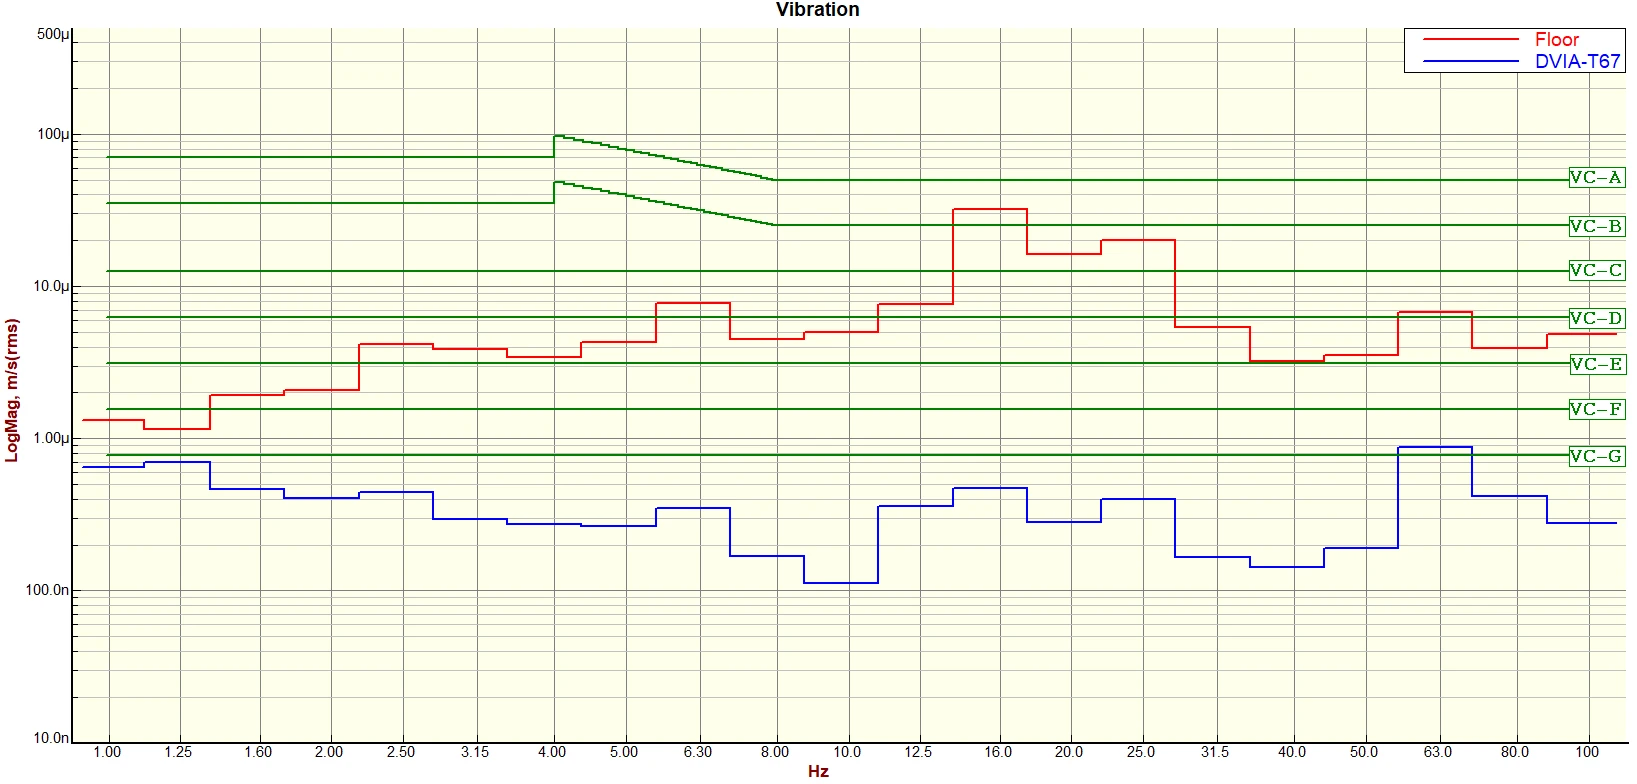
| Tier-1 Semiconductor Cheongju 1st Campus P&T6 4th-floor Cleanroom K16 1. Floor vibration 2. DVIA-T67 | Turned on/IDLE | Vertical | VC-A @ 40 Hz | VC-G @ 40 Hz |
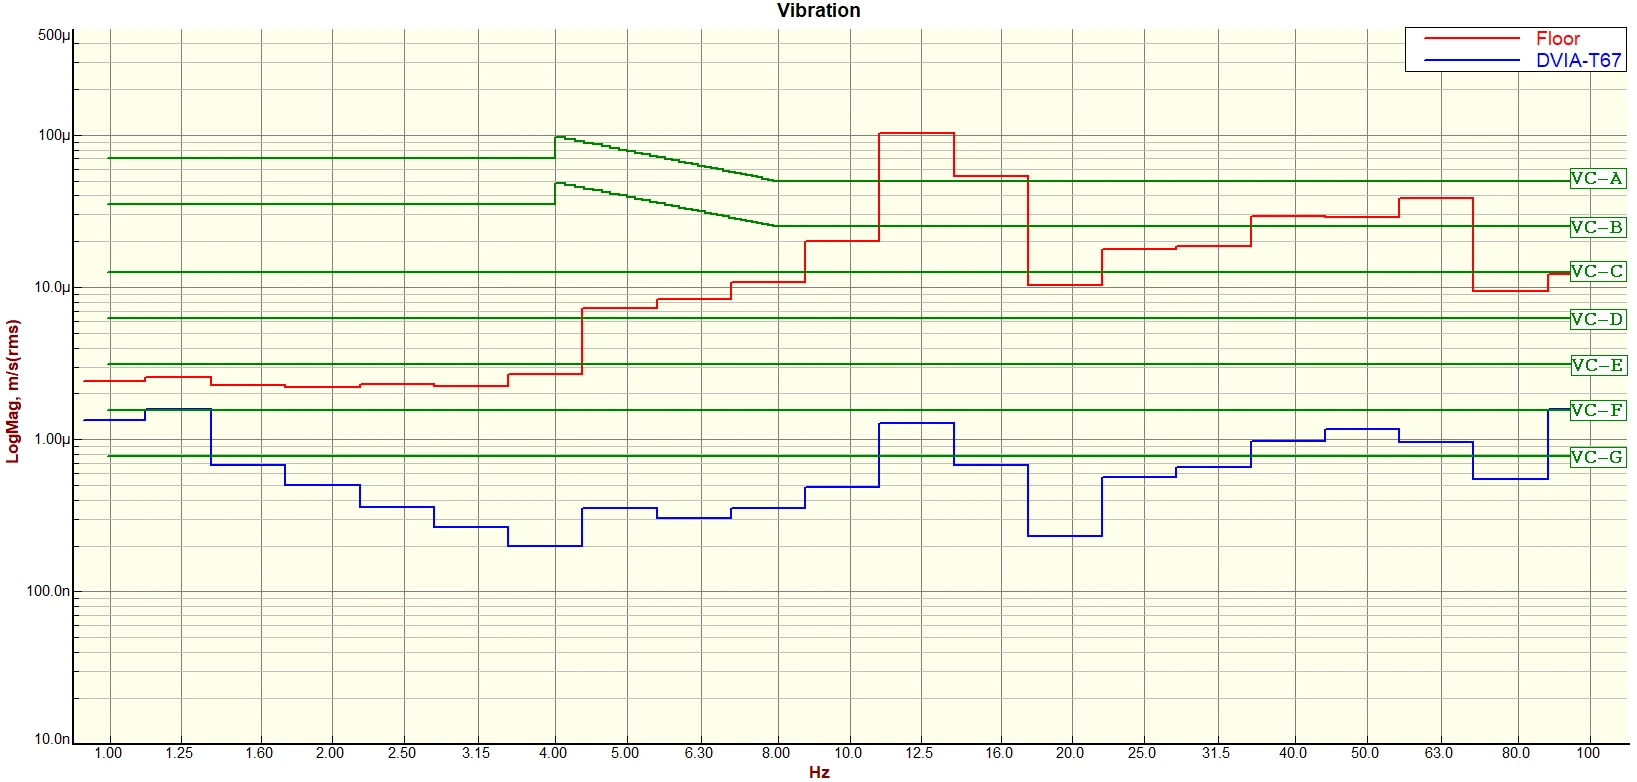
| Left to Right | Residential Area @ 6.3 Hz | VC-D @ 6.3 Hz | ||
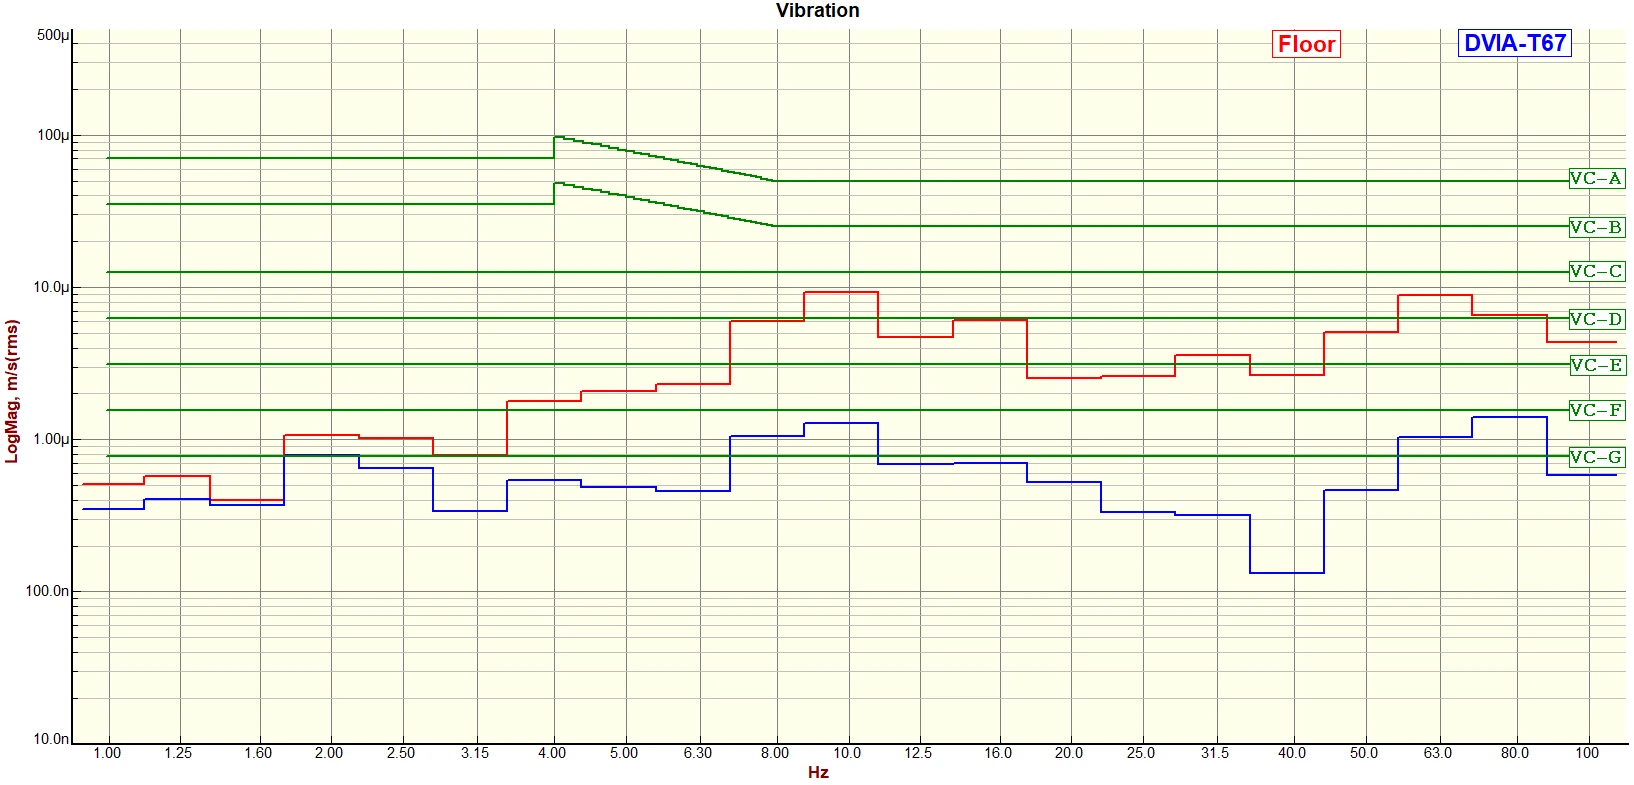
| Front to Back | Operating Theatre @ 6.3 Hz | VC-C @ 6.3 Hz |
Data and Image
Vertical VC Curves
Vertical Autospectrum
Vertical Transmissibility
Left to Right VC Curves
Left to Right Autospectrum
Left to Right Transmissibility
Front to Back VC Curves
Front to Back Autospecturm
Front to Back Transmissibility
Reference
Notes:
1. VC-A/B is measured in 1/3 octave bands from 8-80 Hz, VC-C through VC-G from 1-80 Hz.
2. Detail size refers to line widths in microelectronics manufacturing or particle sizes in medical research.