Installation Report
DVIA-T Series
05-27-2016
DVIA-T56 (T56_150kg) Measurement Report
DVIA-T Series
Installation Report
DVIA-T56
Measurement Report
Installation & Mesurement Date
2016.05.23.
Reporting Date
2016.05.27
Organization
DAEIL SYSTEMS
LIM JONG UK
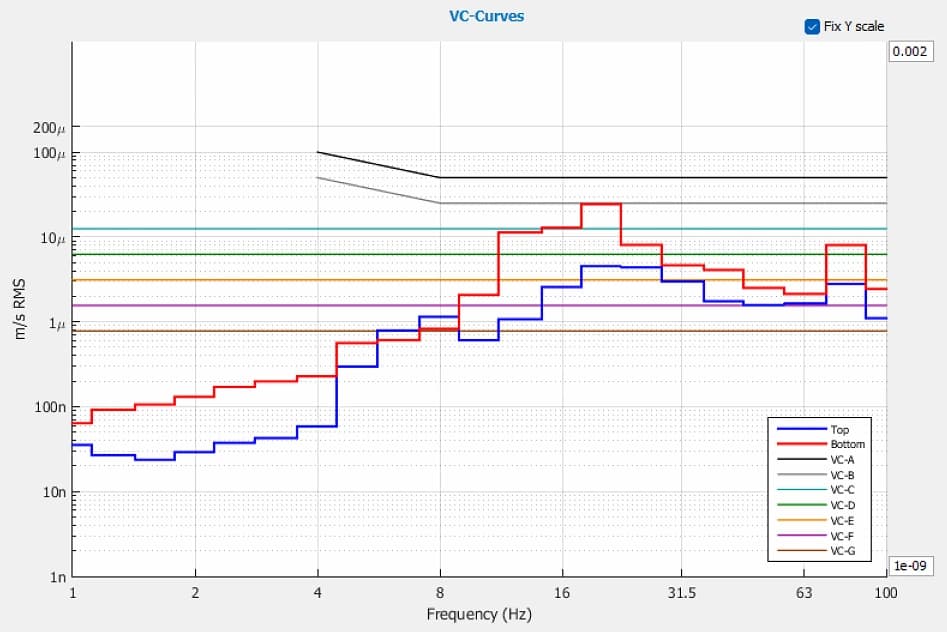
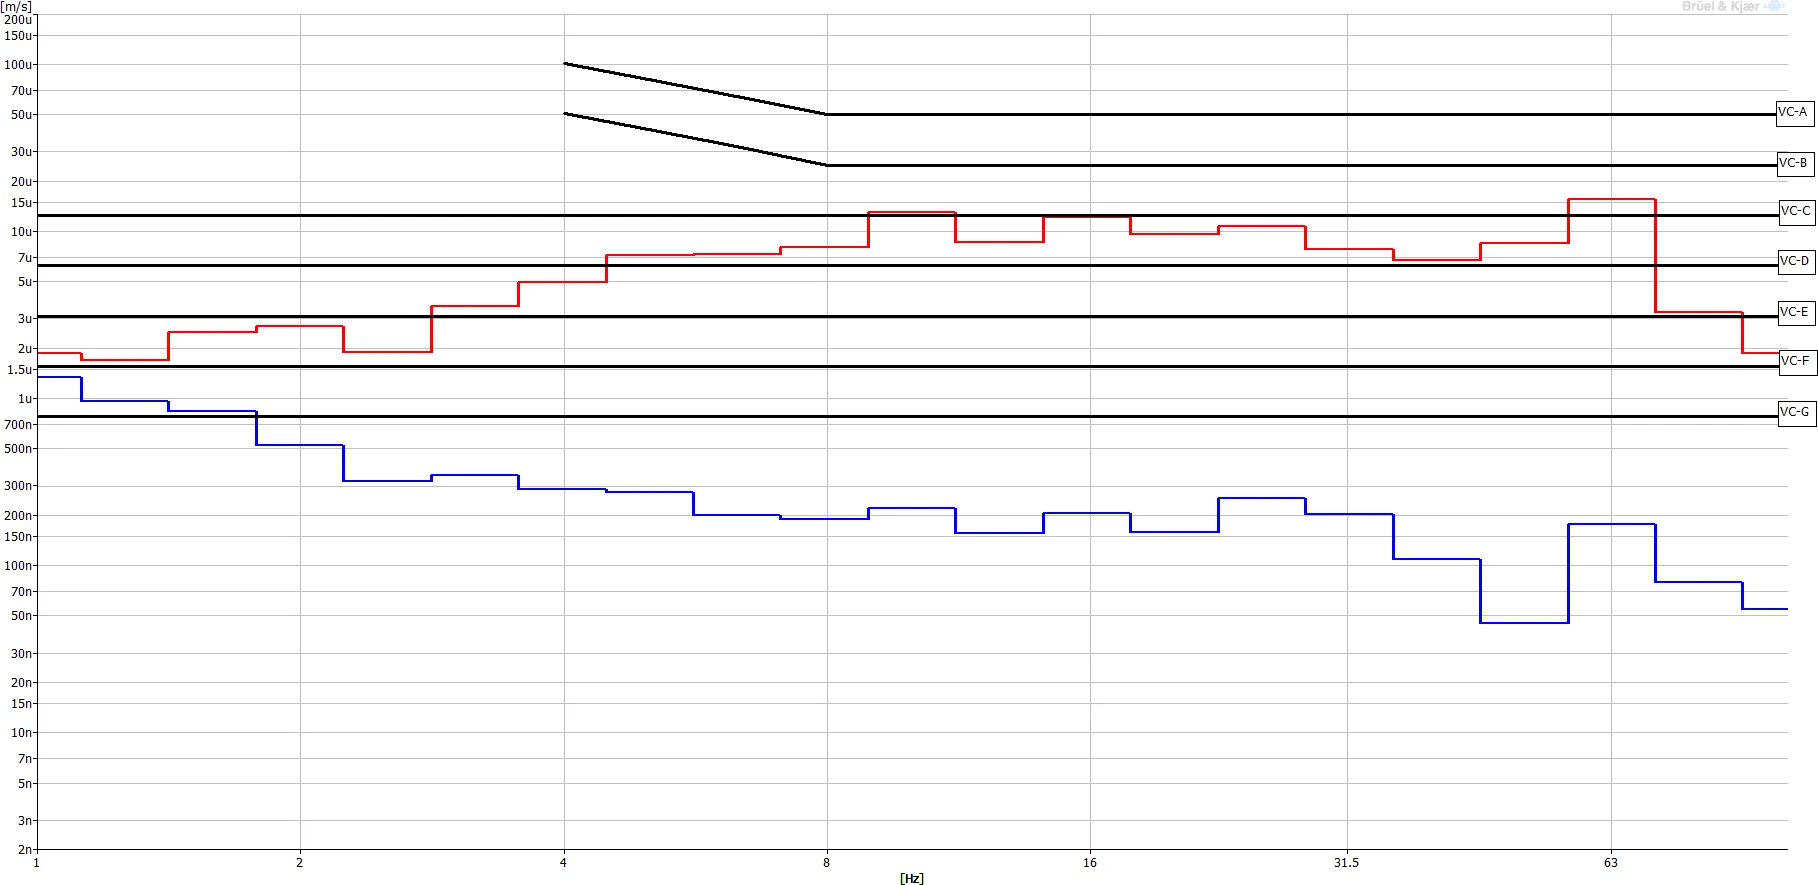
※ Installation Results Summary
| Test Direction | Base | Top |
|---|---|---|
| Z | C | E |
| X | C | D |
| Y | B | E |
Good performance in all directions.
Vertical axis Z is C Class, the horizontal axis X is C Class, the horizontal axis Y is B Class. It was measured vibration environment in floor.
Vertical axis Z is E Class, the horizontal axis X is D Class, the horizontal axis Y is E Class. It was measured vibration environment in top of Active state.
Used data of internal program to making performance graph, show "Result 1".
conversion unit in 1/3 octave band, Show "Result 2".
Result 1 (Performance graph – Transmissibility)
ACTIVE (dB)
Z axis
X axis
Y axis
ACTIVE (multiple)
Z axis
X axis
Y axis
PASSIVE (dB)
Z axis
X axis
Y axis
PASSIVE (multiple)
Z axis
X axis
Y axis
Result 2 (Performance graph used data of PULSE – 1/3 Octave band)
ACTIVE
Z axis
X axis
Y axis
PASSIVE
Z axis
X axis
Y axis
Reference
Notes:
1. VC-A/B are measured in one-third octave bands from 8–80 Hz; VC-C through VC-G are measured from 1–80 Hz.
2. Detail size refers to line widths in microelectronics manufacturing or particle size in medical research.
Share this Case Study
Case Study Information
Category
Installation Report
SeriesDVIA-T Series
Date05-27-2016
Tags
DVIA-T Series
Installation Report
DVIA-T56
Measurement Report
Related Case Studies

DVIA-T Series
Shanghai Opotong Instruments COXEM EM 40 DVIA-T56 (260202R1-6) Re-Tuning Report
05-14-2026Read more
DVIA-T Series
Shuyu Industrial SCINCO STA 1000 DVIA-T56 (250102R2-2) Re-Tuning Report
05-06-2026Read more
DVIA-T Series
Seoul Asan Hospital Tomocube DVIA-T56 Fluorescence Holographic Tomography Microscope Installation Report
07-04-2025Read more