Quanta FEI FEG250 SEM DVIA-MB1000 — China business trip report (MB1000 P13, October 2015)
Contents
Report title and scope
China business trip report (MB1000_P13 Set up)
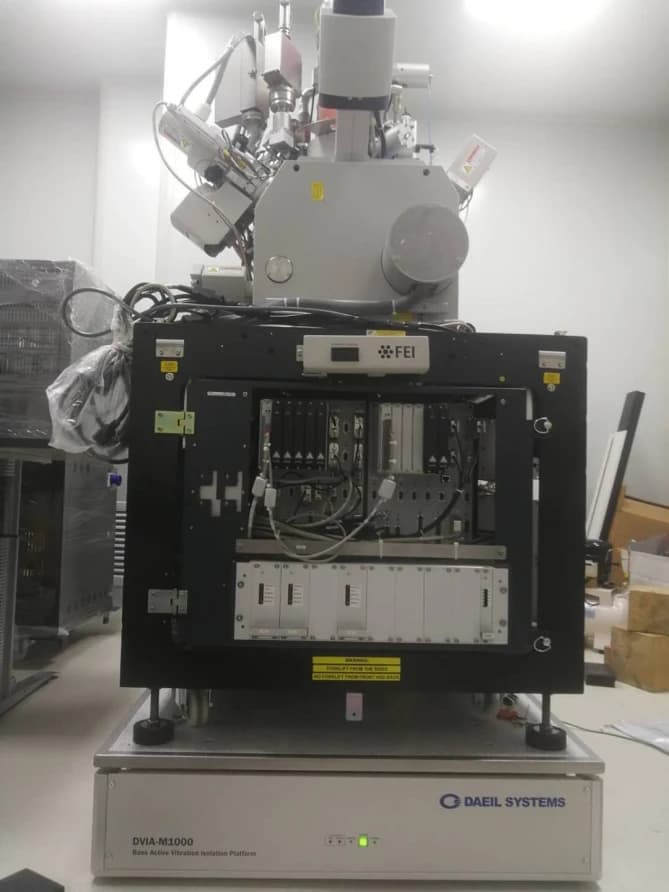
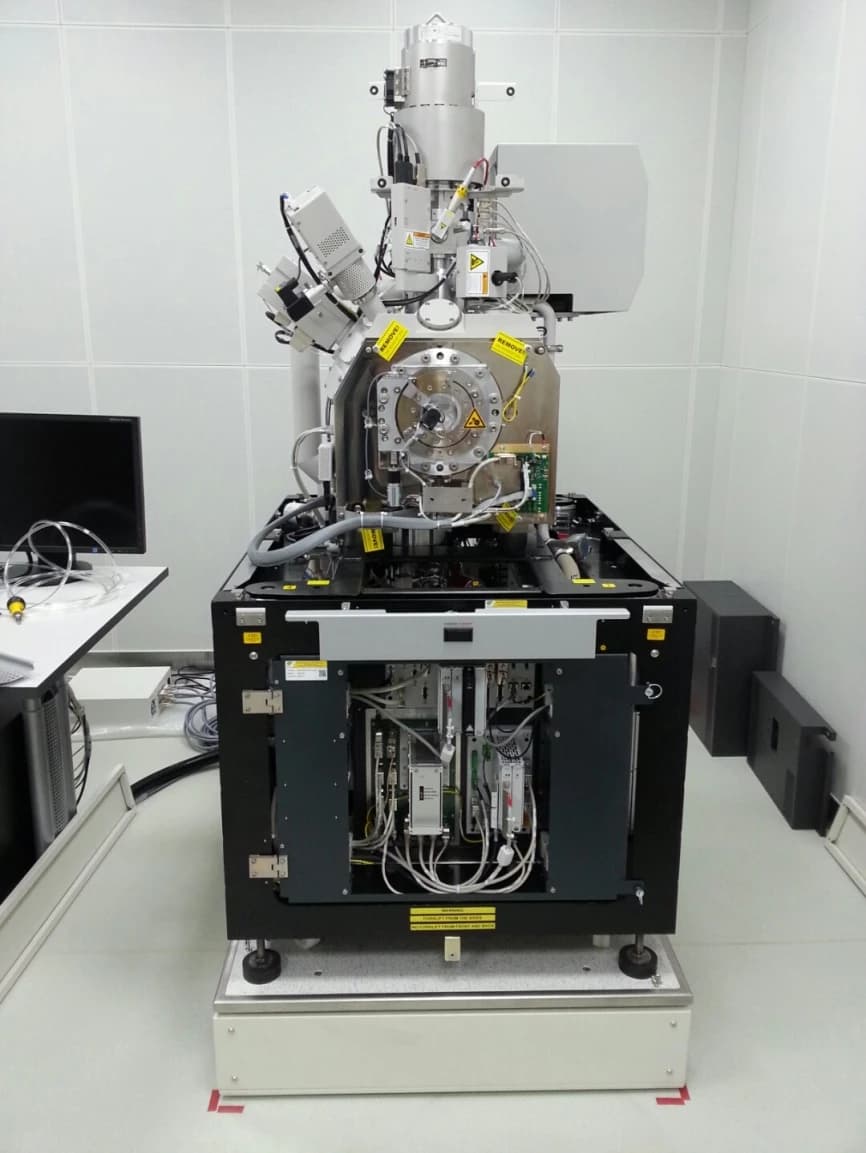
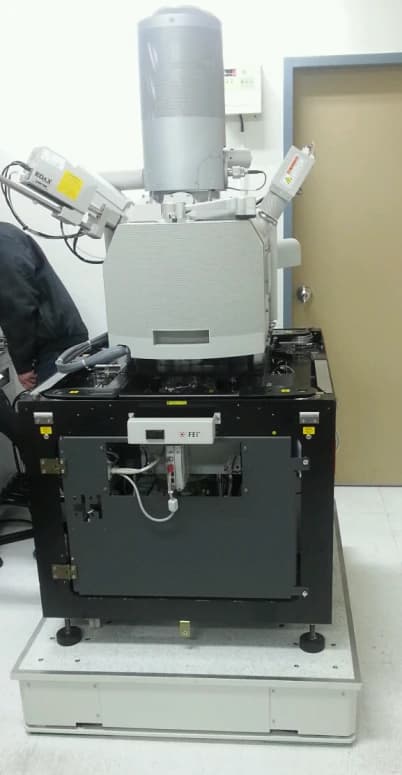
Target equipment
Quanta feg 250 SEM
Site photograph
Trip dates, travelers, and report date
| Field | Value |
|---|---|
| Trip dates | 15.10.26 ~ 15.10.29 |
| Travelers | Choi Hyoung-mun, Lim Jong-wook |
| Report date | 2015.10.30 |
Business trip schedule
15.10.26
Depart; arrive at accommodation
15.10.27~15.10.28
MB1000_P11 Set-up and vibration-environment measurement
15.10.29
Active specification discussion
Return
Installation results summary
| Condition | Test Direction | Base | Top |
|---|---|---|---|
| ACTIVE | Z | C | E |
| X | C | E | |
| Y | D | E |
Good overall performance across all axes.
The floor vibration environment was measured as vertical C-Class, horizontal X C-Class, and horizontal Y D-Class. The horizontal-axis floor vibration is especially sensitive at low frequencies.
With active isolation engaged, vibration on the top plate is E-Class on Z, X, and Y, which is satisfactory overall.
In the one-third octave band, polarity reversal above 20 Hz between base and top in all axes is judged to relate to conversational noise, pump noise, and air-conditioning.
A peak appearing on TOP that did not occur on BASE (see Attachment 2 — green-circle callout on the plotted copy) may be SEM frame resonance.
According to the customer, the image shakes at ×520000 active magnification (Attachment 3).
From inspection of the plotted data, isolator behaviour looks adequate overall, though very poor low-frequency floor conditions mean isolation is unlikely to appear perfect everywhere (Attachment 3).
Attachment 1 — MB1000 internal program performance measurement results
Internal program — Z-axis overview
Internal program — Z-axis — Transmissibility
Internal program — Z-axis — Autospectrum of table
Internal program — Z-axis — Autospectrum of floor
Internal program — X-axis — Transmissibility
Internal program — X-axis — Autospectrum of table
Internal program — X-axis — Autospectrum of floor
Internal program — Y-axis — Transmissibility
Internal program — Y-axis — Autospectrum of table
Attachment 2 — Vibration environment measurement results
Vibration environment — Z axis
Vibration environment — X axis
Vibration environment — Y axis
Attachment 3 — SEM equipment measurement results (image)
SEM — Active 300,000×
SEM — Active 520,000×
SEM — Passive 520,000×
SEM — Floor 520,000×
Share this Case Study
Case Study Information
Related Case Studies
FEI Teneo LoVac DVIA-MB1000 (MB1000 P33) China trip report — 2017.01.16
FEI NOVA450 DVIA-MB1000 (MB1000 P8) installation worksheet — Seoul Hanyang University — 2020-07-14