DVIA-M1000 P3 factory performance test (2014)
Contents
Product Performance Test Report
Model : DVIA-M1000 P3 (서울대 설치 예정)
Purpose : Performance Test
Measurement Engineer : Sungwon Choi
Time and Place : Factory in DaeilSystem, 2014-6-4
Measurement : Vertical, Horizontal direction Transmissibility
Supporting figure after test scope
Test equipment
Data Acquisition system : VAAV-1000E monitoring program/3050-B-040
Accelerometer : GS-11D in DVIA-M units/23435,35151(PCB)
Frequency Range : 0.5~100Hz
Test Conditions
Load Weight :약 700kg(프레임 상판 자체중량 포함)
Isolation system : 1set
Inner Air Pressure : N/A
Measurement methods
Sensor Position : Center
Moving Direction : N/A
Supporting figure after measurement methods
Test Result (Transmissibility)
Table 1. Summary
| Test Direction | Resonance Frequency [Hz] | Roll-off Rate [dB] |
|---|---|---|
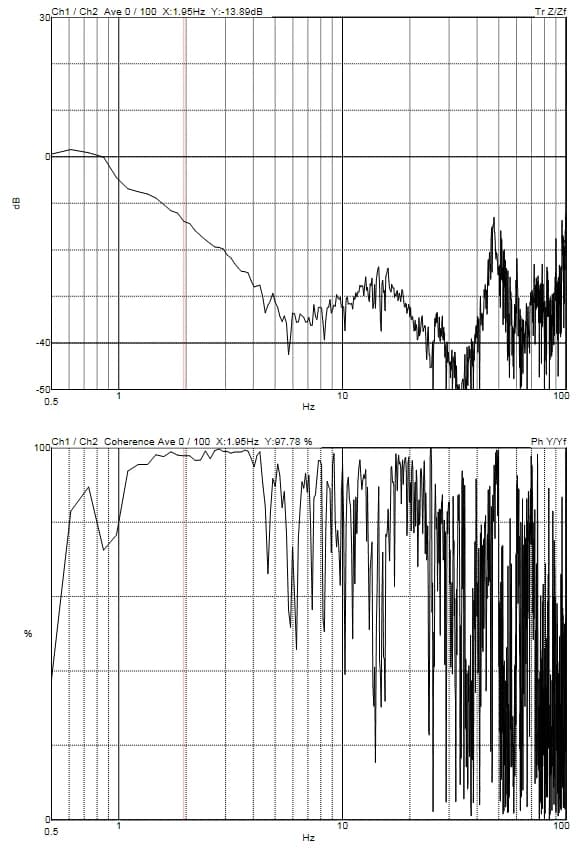
| Z Center | N/A | -28.3 |
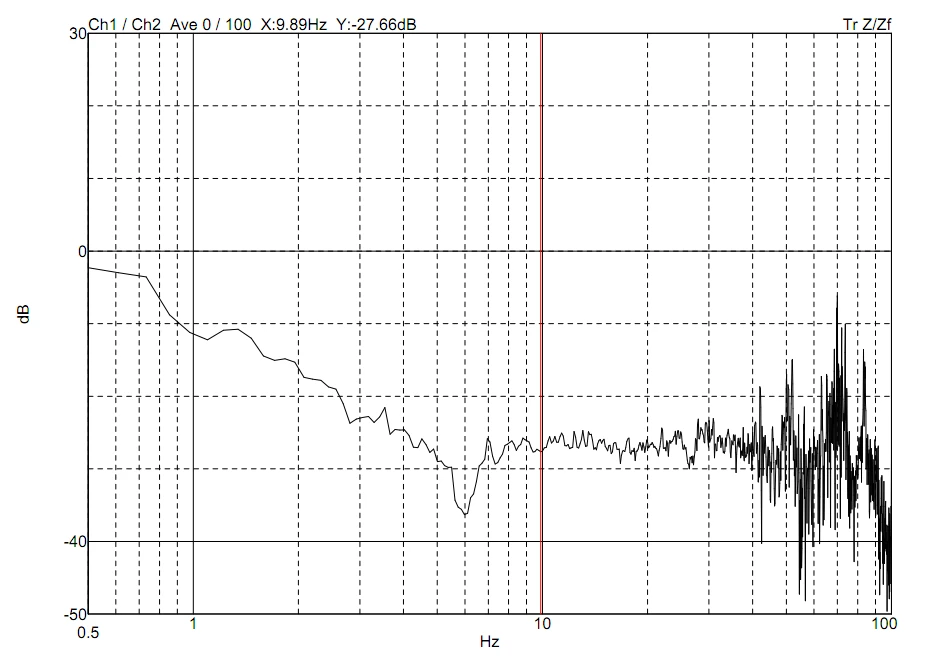
| X Center | N/A | -36.3 |
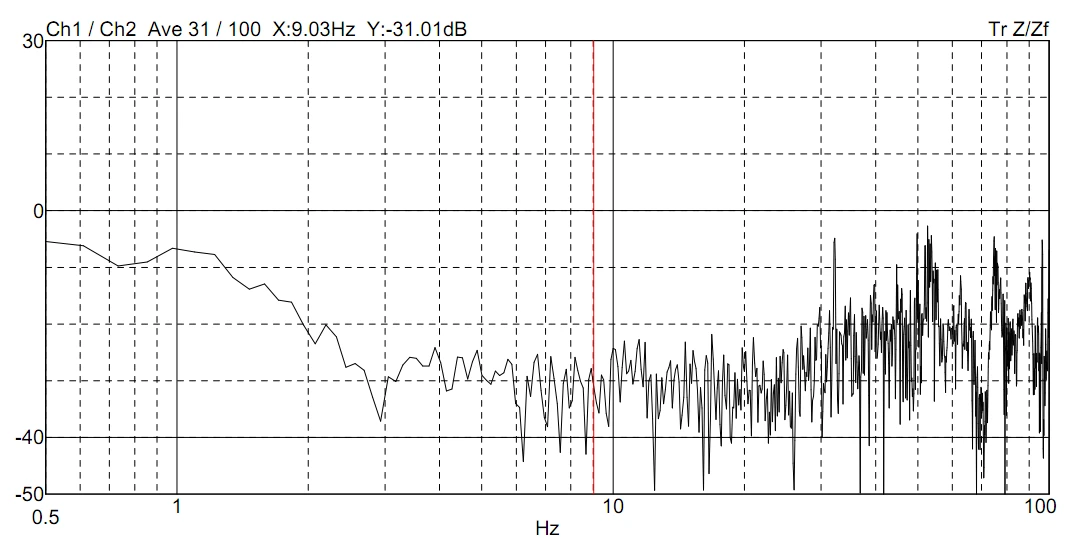
| Y Center | N/A | -34.0 |
Roll-off Rate is evaluated at 10 Hz.
VAAV built-in program results — FFF Z
VAAV built-in program results — FFF X
VAAV built-in program results — FFF Y
Pulse measurement and cardboard test environment
Passive X traces
Issues and improvements
Performance from 1–20 Hz is favorable in all directions.
The Y axis shows reduced high-frequency performance; it can be improved sufficiently with tuning, and closing tuning without close review was an issue.
When corrugated cardboard was not placed under the dummy, there were no abnormal peaks in the high-frequency region for passive and open-loop characteristics.
With cardboard under the dummy, an 85 Hz peak appeared in the X direction, confirming that the horizontal abnormal peak seen on M1000 P2 was caused by cardboard. Little effect appeared in Y and Z, and Chief Manager Tanaka's view that directional resonance is attributable to corrugated cardboard is considered reasonable.