Samsung Advanced Institute of Technology SAIT Nikon NSR-2205i12D DVIA-P7000 Inspection Report
Contents
Overview
DVIA-P7000 operational status inspection and vibration measurement were performed.
Inspection and vibration measurement were conducted with the equipment in IDLE state (equipment vibration is typically in the 10–30 Hz band).
Overall performance was somewhat reduced; compared with graphs from the same Stepper equipment measured on 2023-04-14 with the equipment Turned off, upper-plate vibration is inferred to be elevated due to equipment IDLE vibration [see 140416R6-1 Report].
System Information
Model: DVIA-P7000
Serial Number: 140416R6-2
Serial Number (SAC-07): 022601
Engineer
Youngha Lee, Jongwon Park from DAEIL SYSTEMS
Inspection Date
December 12, 2023
Report written date
December 18, 2023
Trip dates
Date of business trip : 17.12.27~17.12.29
Prepared for
Samsung Advanced Institute of Technology
Location
SAIT Cleanroom Building A, Suwon
Equipment
Stepper NSR-2205i12D
Summary of Vibration Results
| Measurement Point | Z-axis (Vertical) 1–10 Hz | Z-axis (Vertical) 12.5–80 Hz | X-axis (Left to Right) 1–10 Hz | X-axis (Left to Right) 12.5–80 Hz | Y-axis (Front to Back) 1–10 Hz | Y-axis (Front to Back) 12.5–80 Hz |
|---|---|---|---|---|---|---|
| Floor | F | A | D | Residential Area (ISO) | F | A |
| Active | C | OperationTheatre (ISO) | D | B | E | C |
Field Notes
When the equipment is generally in IDLE state, equipment vibration can occur in the 10–30 Hz band or higher-frequency bands, which may be measured on the top plate.
Compared with data from the same Stepper equipment inspected on 2023-04-14, upper-plate vibration is inferred to be elevated due to equipment IDLE vibration [see 140416R6-1 Report].
For accurate inspection and tuning of the isolation platform, the upper equipment should be completely Turned off.
Vibration Measurement
8.1) PULSE 22
Hardware: Bruel & Kjaer Type 3050-A-040
Software: LapShop Application(PULSE Lapshop)
8.2) Accelerometer
PCB Accelerometer
Model: 393B05
Data and Image
The accelerometer and displacement sensors correctly sense vibration changes and operate normally.
Accelerometer Sensor
Displacement Sensor
Z-axis (Vertical) Passive Transmissibility
On the passive transmissibility graph, the DVIA-P resonance peak is below 10 Hz but appears asymmetric.
Resonance peaks from installation structure and utilities appear at 10 Hz and in the 20–80 Hz band, as do peaks attributed to equipment IDLE vibration.
Z-axis (Vertical) Feedforward Transmissibility, FFT Vibration (Floor, Active)
On the active transmissibility graph, transmissibility is 0 dB or higher in the 1–7 Hz band, suggesting vibration from installation structure, utilities, and upper-equipment IDLE state.
Numerous additional peaks suspected from upper-equipment IDLE vibration appear in other bands.
X-axis (Left to Right) Passive Transmissibility
[No Picture]
X-axis (Left to Right) Transmissibility, FFT Vibration (Floor, Active)
On the active transmissibility graph, performance is poor (0 dB or higher) in the 1–10 Hz band, likely due to installation structure, utilities, or equipment IDLE vibration.
Resonance peaks attributed to equipment IDLE vibration appear at 50, 60, and 80 Hz.
Y-axis (Front to Back) Passive Transmissibility
On the passive transmissibility graph, the DVIA-P resonance peak is below 10 Hz with a blunt shape.
Resonance peaks attributed to equipment IDLE vibration appear at 35, 42, and 50 Hz.
Y-axis (Front to Back) Transmissibility, FFT Vibration (Floor, Active)
On the active transmissibility graph, performance is poor (0 dB or higher) in the 1–10 Hz band, likely due to installation structure, utilities, or equipment IDLE vibration.
A resonance peak attributed to equipment IDLE vibration appears at 35 Hz.
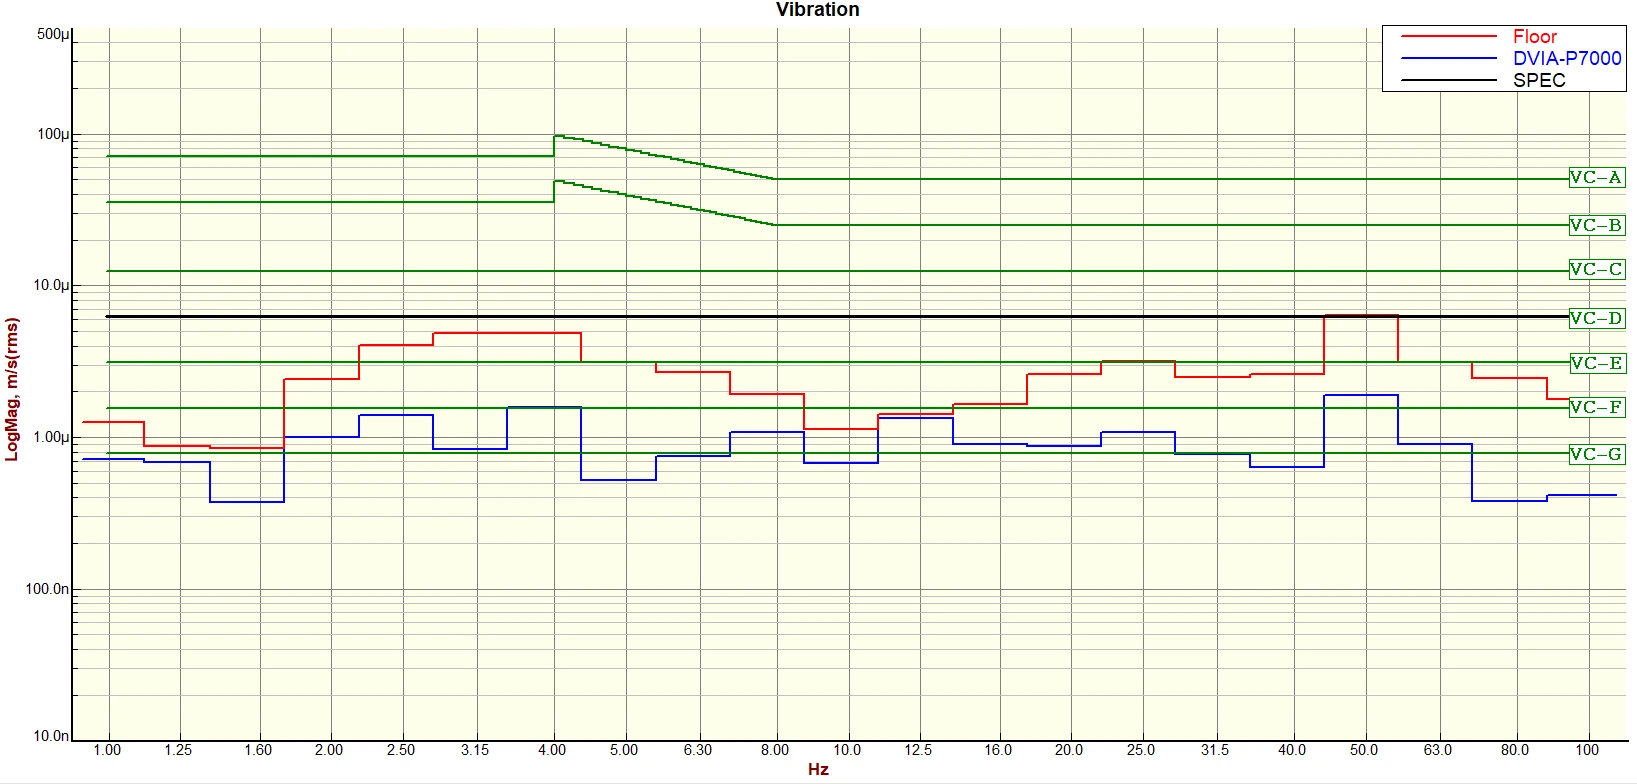
Z-axis (Vertical) VC curves
At low frequency, vibration is below VC-F with low attenuation characteristic of proportional vibration, but with a large rise.
From 10–60 Hz the top plate exceeds the floor; compared with the Daeil UI Program transmissibility graph, this is attributed to upper-equipment IDLE vibration.
Compared with the same Stepper measured with equipment Turned off, IDLE-state vibration is the likely cause [see 140416R6-1 Report].
Z-axis (Vertical) VC curves (21.12.15 측정)
X-axis (Left to Right) VC curves
At low frequency, vibration is below VC-F with low attenuation characteristic of proportional vibration.
Performance is somewhat reduced up to 10 Hz, then improves.
Compared with the same Stepper measured with equipment Turned off, IDLE-state vibration is the likely cause [see 140416R6-1 Report].
X-axis (Left to Right) VC curves (21.12.15 측정)
Y-axis (Front to Back) VC curves
At low frequency, vibration is below VC-F with low attenuation characteristic of proportional vibration.
Performance is somewhat reduced up to 10 Hz, then improves.
Compared with the same Stepper measured with equipment Turned off, IDLE-state vibration is the likely cause [see 140416R6-1 Report].
Y-axis (Front to Back) VC curves (21.12.15 측정)
Reference
Generic Vibration Criteria
Notes:
- As measured in one-third octave bands over 8-80 Hz (VC-A/B) or 1-80 Hz (VC-C through VC-G).
- Detail size refers to width in microelectronics fabrication or particle size in medical research.
Share this Case Study
Case Study Information
Related Case Studies

Tier-1 Semiconductor Suwon Nikon NSR-2205i12D DVIA-P7000 Inspection Report
Huahong Dongfang Jingyuan SEpA_i515 DVIA-P7000 Installation Report
