Yonsei University Unisoki Low Temperature SPM USM1200 DVIA-ML1000 (240821R5) Installation Report
Contents
Overview
Tuning and vibration measurement were performed for the DVIA-ML1000 installed at Yonsei University Advanced Science and Technology Research Building.
After equipment placement, vibration measurement and tuning were conducted with the equipment in IDLE state.
Performance verification was carried out by vibration measurement using Brüel & Kjær DAQ equipment.
Data are presented as VC curves, and reference material on vibration levels is provided.
Vibration Isolation System Info
Model: DVIA-ML1000
Serial Number: 240821R5
Engineer
Chaewon Lee, DAEIL SYSTEMS Field Engineer
Tuning Date
November 19, 2024
Report written date
November 21, 2024
Prepared for
N/A
End User
Yonsei University
Number of Tuning Trial
N/A
Location
Quantum Imaging Laboratory, Advanced Science and Technology Research Building, Yonsei University
Equipment
Manufacturer: Unisoki
Equipment: Low Temperature SPM
Model: USM1200
Equipment Status
장비 설치 및 IDLE
Measurement Device
8.1) Brüel & Kjær LAN-XI DAQ Type 3050
-Hardware: B&K Front End Type 3050-A-040
-Software: B&K Pulse Labshop 22 Version
8.2) Accelerometer
PCB Accelerometer
Model: 393B05
Vibration specification
Measurement Setup
Bandwidth: 200 Hz
Lines: 800
Averaging: Spectrum Averaging
Engineering Units: m/s
Window: Hanning
Overlap: Max
Conclusion
All directions satisfy the vibration specification.
In some frequency bands, the observed vibration amplification is vibration inherent to the USM1200 itself.
Measurement Summary
| Measurement location | Status | Direction | Floor vibration | DVIA-ML1000 | Floor result | Platform result |
|---|---|---|---|---|---|---|
| 연세대학교 양자 이미지 연구실 1. Floor 2. DVIA-ML1000 | 장비 설치/IDLE | Vertical | VC-G @ 31.5 Hz | VC-G @ 31.5 Hz | ✓ PASS | ✓ PASS |
| 연세대학교 양자 이미지 연구실 1. Floor 2. DVIA-ML1000 | 장비 설치/IDLE | Left to Right | VC-G @ 20 Hz | VC-G @ 20 Hz | ✓ PASS | ✓ PASS |
| 연세대학교 양자 이미지 연구실 1. Floor 2. DVIA-ML1000 | 장비 설치/IDLE | Front to Back | VC-G @ 20 Hz | VC-G @ 20 Hz | ✓ PASS | ✓ PASS |
Data and Image
Vertical VC Curves
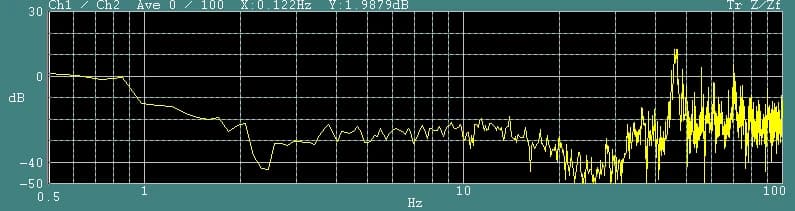
Vertical Autospectrum
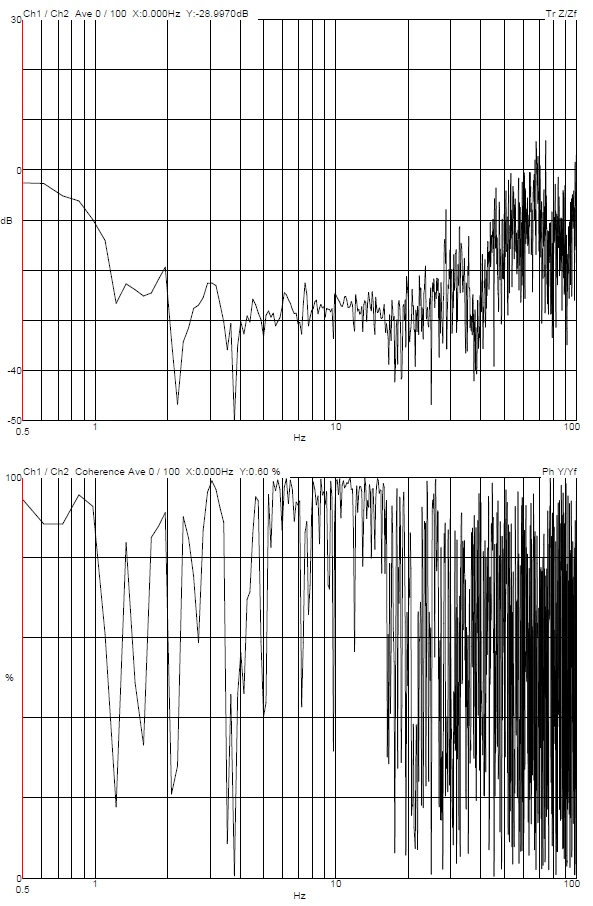
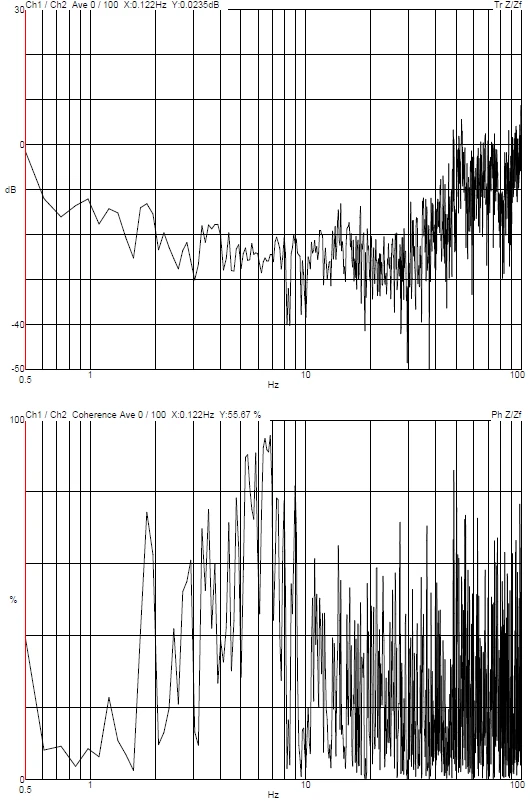
Vertical Transmissibility
Left to Right VC Curves
Left to Right Autospectrum
Left to Right Transmissibility
Front to Back VC Curves
Front to Back Autospectrum
Front to Back Transmissibility
Equipment photo
Reference
Notes:
- As measured in one-third octave bands over 8-80 Hz (VC-A/B) or 1-80 Hz (VC-C through VC-G).
- Detail size refers to width in microelectronics fabrication or particle size in medical research.
Share this Case Study
Case Study Information
Related Case Studies
YIMO Unisoku STM DVIA-ML1000 (250331R2) Installation Report
YIMO BYD Semiconductor ZEISS Crossbeam 550 FIB-SEM DVIA-M1000 (240314R6) Installation Report