Korea University M1000 P7 vibration survey — 2014-07-25
Contents
Vibration environment measurement (Korea University)
Overview
To verify whether the vibration environment meets the user’s requirements after installation of the M-1000 P7 vibration isolation platform.
Measurement date and time: 2014-07-25 (Fri) 17:30, measurer: Choi, Sungwon
Measurement site: 2nd floor, Industry–University Building, College of Engineering, Korea University
4. Measurement conditions and results
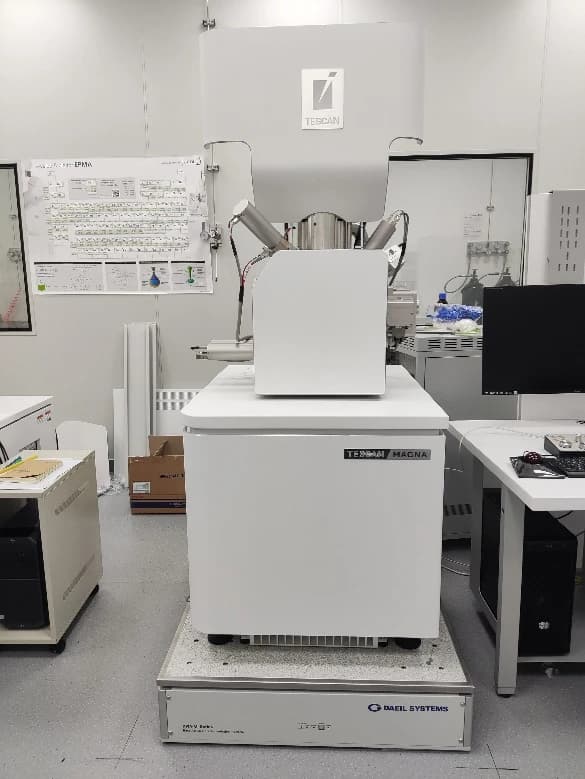
With the FEI SEM installed, tuning and vibration measurements were carried out while some equipment functions were operating.
Measurement locations were the front-center of the isolator top plate and the front floor (base) of the isolator.
Site photograph
Summary of results
| Test direction | Axis | VC-Class (Base) | VC-Class (Top) | Transmissibility [dB@10Hz] |
|---|---|---|---|---|
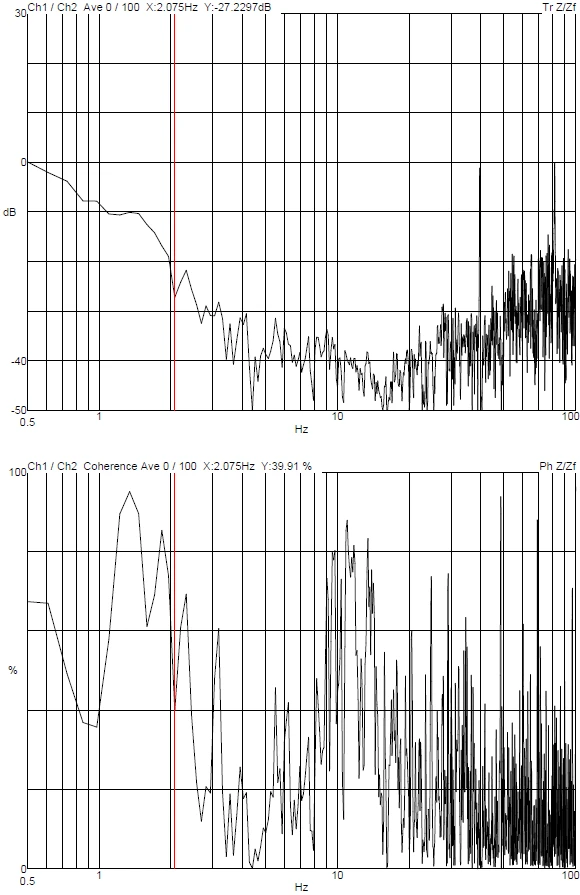
| ACTIVE | Z (가진) | C | G | -27.4 |
| X | E | G | -37.9 | |
| Y | E | G | -35.7 |
Isolator intrinsic performance is favorable.
With Active on, the vibration environment on the isolator top is E Class or better.
The FEI side indicated that because the vibration environment during setup was much more favorable than typical day-to-day conditions, pass/fail could not be determined. Low-frequency motion from foot traffic was the main concern; it was agreed to measure during daytime hours when student traffic is higher and to report on the following Monday (2014-07-28). Accordingly, for the Z axis, measurement was performed under forced excitation rather than capturing the ambient site condition as-is.
Judgment: condition favorable.
During tuning, low-frequency phase margin was generally ample and high-frequency phase margin was tight. With low payload mass or changes in passive characteristics, the Z axis was tuned with minimal stability margin and the work was completed.
In Passive state an abnormal peak appeared on the Z axis at 45 Hz; it was also seen in open-loop and made tuning difficult. After the FEI engineer adjusted SEM cabling slack, the anomaly no longer appeared in open-loop and performance could be achieved, but the final performance measurement still showed weaker performance near that frequency.
The apparent limitation in high-frequency horizontal-axis performance is considered to be because high-frequency excitation was not applied.
VAAV program measurement results
Passive Z
Passive X
Passive Y
FFF Z
FFF X
FFF Y
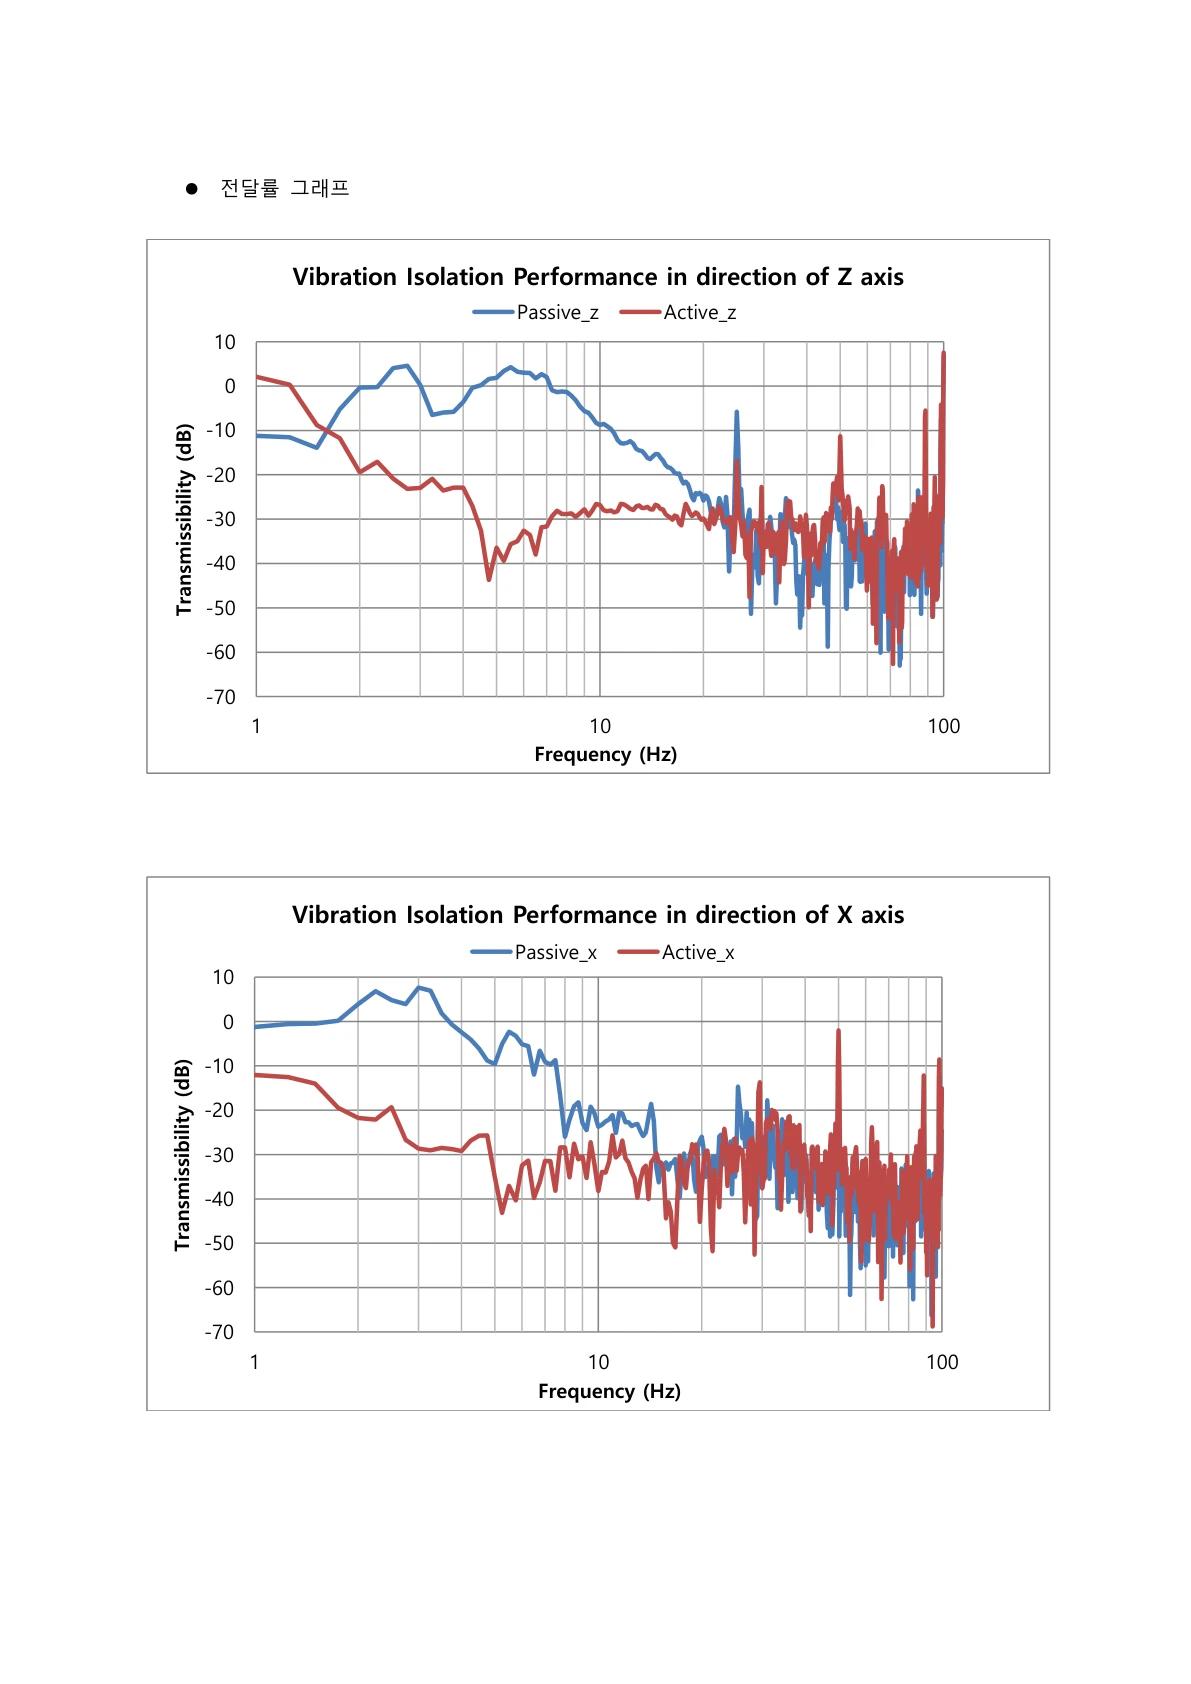
Transmissibility graphs
Transmissibility graphs (sheet 1)
Transmissibility graphs (sheet 2)
Octave band
Octave band — Active Z and Active X
Octave band — Active Y
Share this Case Study
Case Study Information
Related Case Studies
FEI SEM LSM M-1000 P4 vibration environment measurement — 2014-07-08
Chinese Academy of Sciences — Institute of Metal Research ZEISS GeminiSEM360 DVIA-M1000 (230328R2) Installation Report