Bruker BioScience DVIA-M1000 P2 setup survey — Carl Zeiss SUPRA 55 VP demo room (2014-06-18)
Contents
Vibration environment measurement (Bruker BioScience)
Overview
Assessment of whether the vibration environment satisfies the applicant’s requirement after deploying an M-1000 P2 active isolation platform.
Survey date / time : 18 June 2014 (Thu), 16:00 — Engineer : Choi Sung-won.
15F Kin’s Tower, Bruker BioScience demo laboratory.
4. Measurement conditions and results
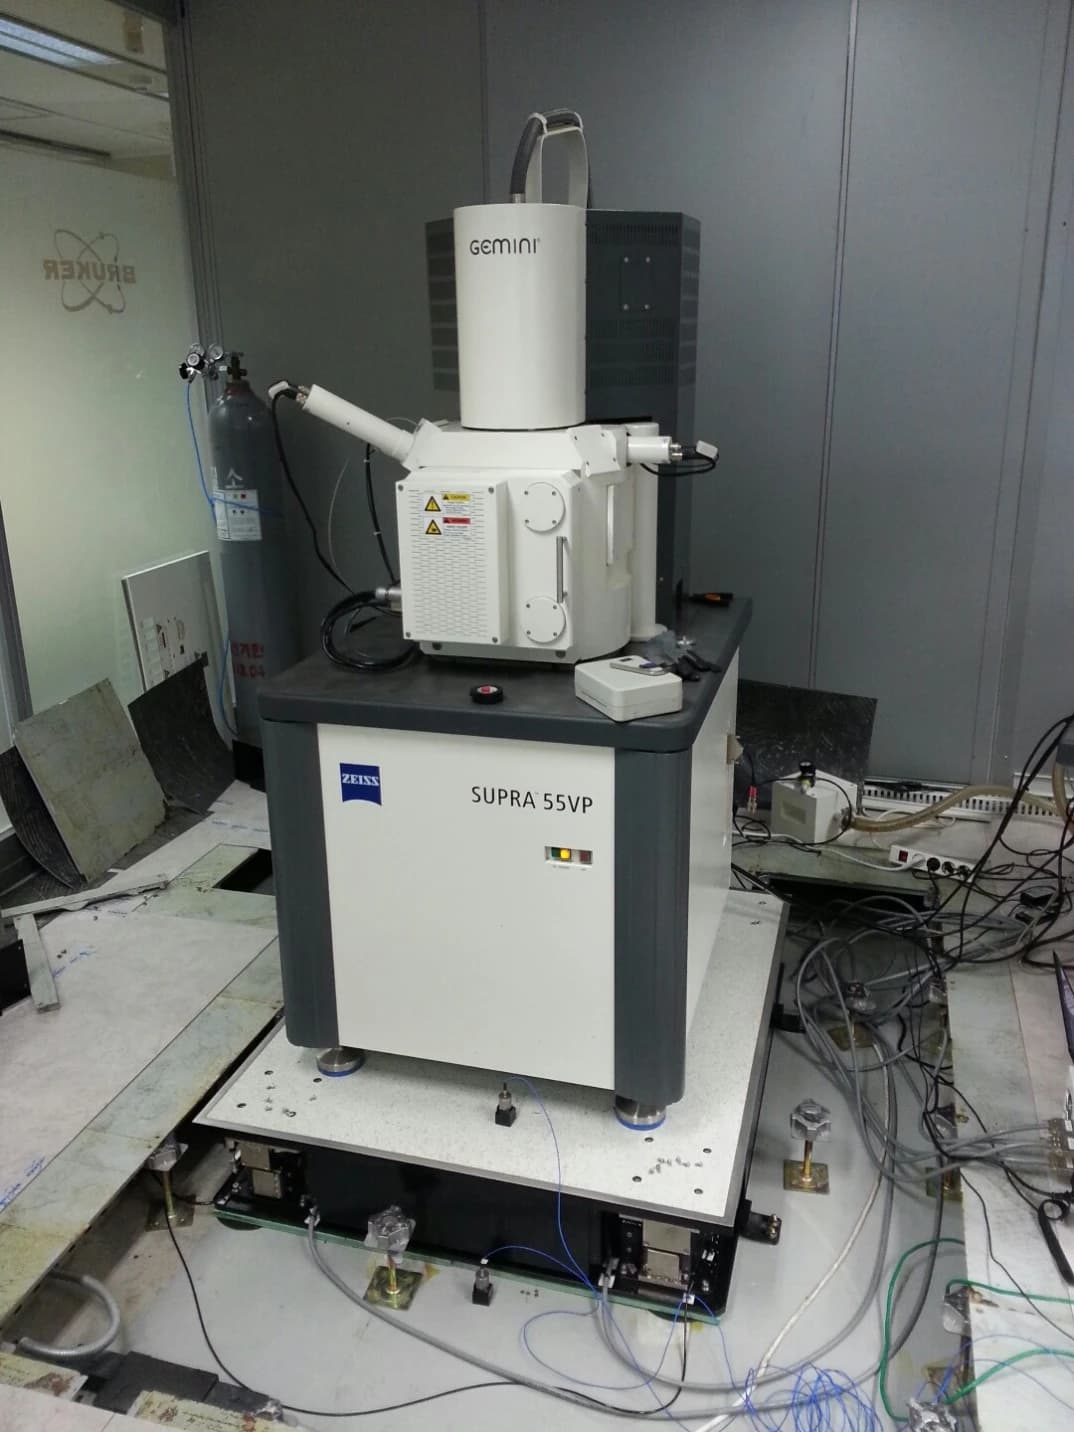
Carl Zeiss hosted equipment SUPRA 55 VP remained on while tuning work and vibration measurement were performed.
The measurement locations were taken on the side of the isolation tabletop (top) and on the slab near the platform (base).
Measurement location diagrams sketch 01
Measurement location diagrams sketch 02
Results summary
| Direction | VC-Class (Base) | VC-Class (Top) | ACTIVE | Transmissibility [dB @ 10 Hz] |
|---|---|---|---|---|
| Z | A | E | E | -26.3 |
| X | E | E | E | -25.7 |
| Y | E | E | E | -29.2 |
Acceptance against SUPRA 55 VP limits
With active control engaged, vibration meets the allowable criteria for SUPRA 55 VP: < 7.2 µm/sec RMS for f > 25 Hz and < 14 µm/sec RMS for f < 25 Hz.
VAAV program captures
FFF Z
FFF X
FFF Y
Reference
Generic Vibration Criteria
Notes:
- As measured in one-third octave bands over 8-80 Hz (VC-A/B) or 1-80 Hz (VC-C through VC-G).
- Detail size refers to width in microelectronics fabrication or particle size in medical research.
Share this Case Study
Case Study Information
Related Case Studies

Bruker BioScience DVIA-M1000 P2 vibration survey — Carl Zeiss SUPRA 55 VP demo room (2014-06-18)
Bruker BioScience demo room — M-1000 P2 vibration environment measurement — 2014-06-18
