Bruker BioScience demo room — M-1000 P2 vibration environment measurement — 2014-06-18
Contents
Vibration environment measurement results (Bruker BioScience)
Overview
To determine whether the vibration environment meets user requirements after installing the M-1000 P2 vibration isolation platform.
Measurement date and time: 2014. 6. 18 (Thu) 16:00; measured by: Choi Seong-won
Measurement site: 15th floor demo room, Bruker BioScience, Kins Tower
4. Measurement conditions and results
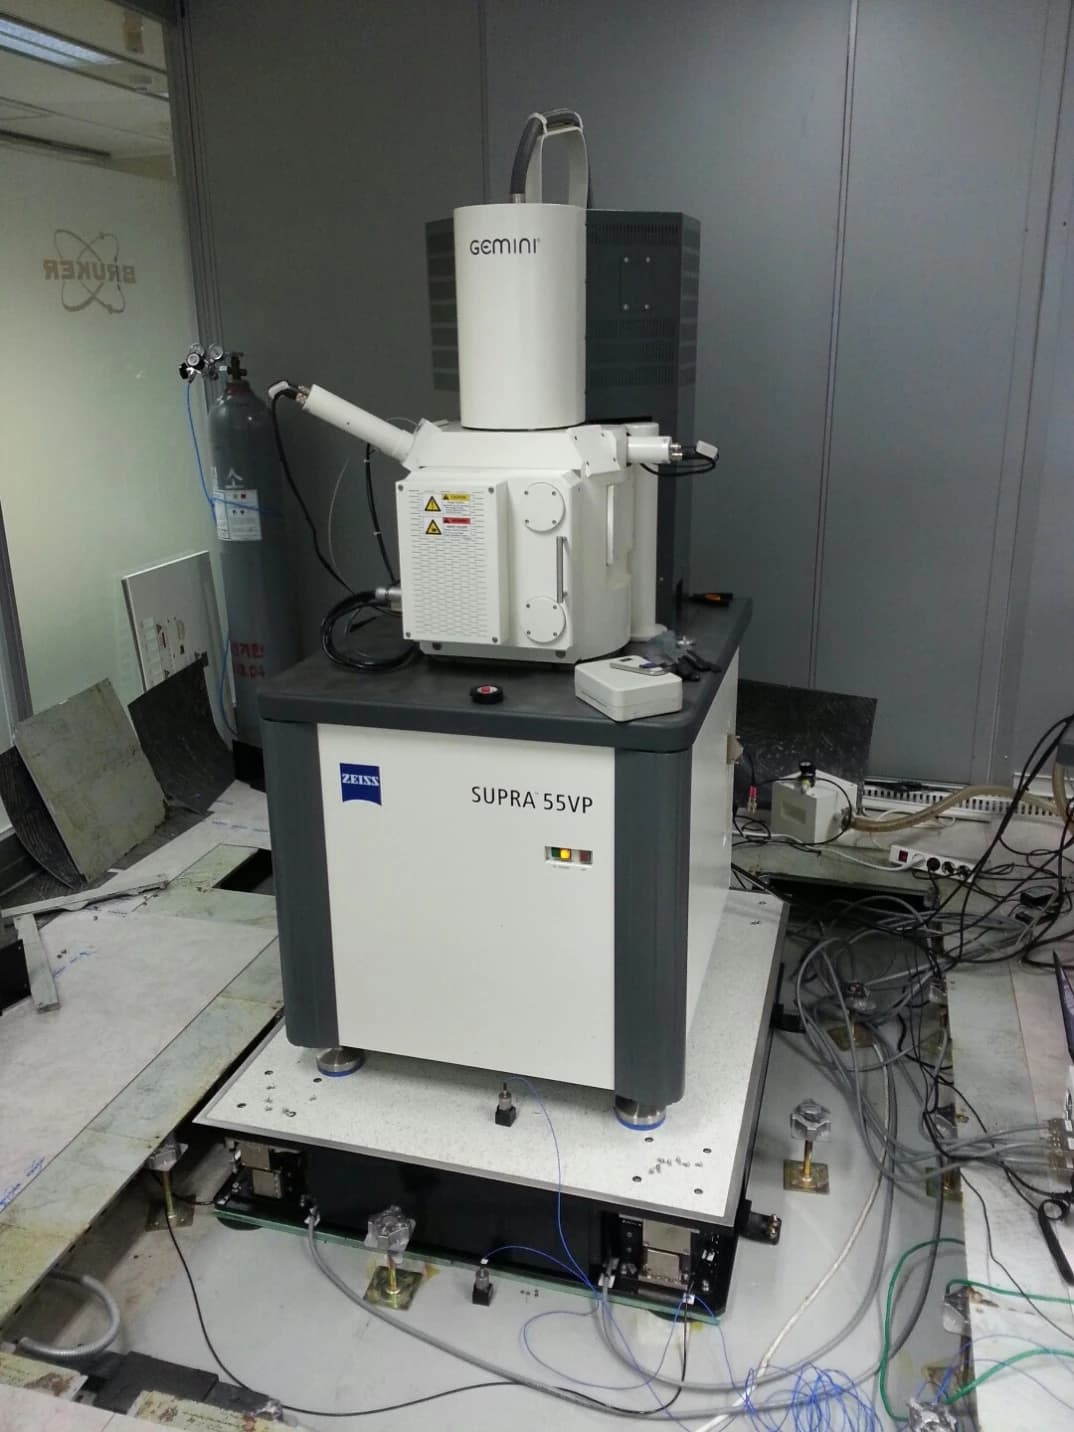
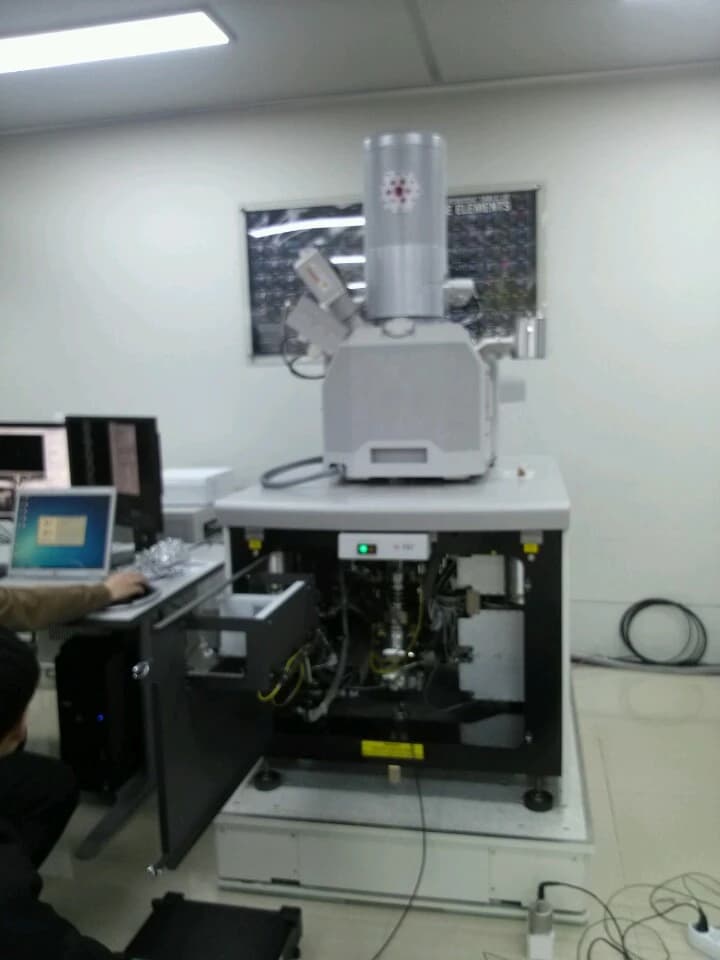
Tuning and vibration measurement were performed while the Carl Zeiss customer equipment was operating.
Measurement positions were the side of the isolator top plate (top) and the floor near the isolator (base).
Measurement site photographs
Results summary
| State | Test direction | VC-Class (Base) | VC-Class (Top) | Transmissibility [dB@10Hz] |
|---|---|---|---|---|
| ACTIVE | Z | A | E | -26.3 |
| X | E | E | -25.7 | |
| Y | E | E | -29.2 |
The isolator intrinsic performance is somewhat lacking on the X-axis but generally satisfactory.
Under active control the vibration environment on the isolator top plate is VC-Class E — satisfactory.
Due to built-in passive isolation within the SEM or other factors, open-loop characteristics were not smooth; gain was set stably, especially because the P and R rotational axes were pronounced.
Peaks between 40–90 Hz on the X and Y axes seen during headquarters testing were not observed during this site setup (headquarters measurement concluded that corrugated cardboard on the dummy floor had been the issue).
VAAV program measurement results
Passive Z
Passive X
Passive Y
FFF Z
FFF X
FFF Y
Transmissibility graphs
Z axis and X axis — passive versus active
Y axis — passive versus active
Octave band
Active Z and Active X — 1/3 octave band
Active Y — 1/3 octave band
Notes:
1. The criteria shown are for RMS vibration velocity measured in one-third octave bands over the frequency range 8–80 Hz (ISO 2631-3).
2. Detail size refers to the line width or spacing on a microelectronic device or similar pictured object being examined.
Reference
Share this Case Study
Case Study Information
Related Case Studies
Bruker BioScience — M-1000 P2 setup results (vibration survey) — 2014-06-18
DVIA-M1000 P9 vibration environment measurement — Incheon Production Technology Institute — 2015-01-05
