Thermo Fisher Scientific Apreo 2S SEM DVIA-ML1000 (251023R5) Installation Report
Overview
DVIA-ML1000 active isolation with Thermo Fisher Scientific Apreo 2S SEM; tuning and UI-program measurements while the tool was Turned on / IDLE.
The Vibration specification is provided as a diagram; the measurement summary compares floor vs DVIA-ML1000 for each axis.
Generic vibration criteria (ISO / VC) are in Reference at the end.
Vibration Isolation System Info
Model: DVIA-ML1000
Serial Number: 251023R5
Engineer
Chaewon Lee, DAEIL SYSTEMS
Tuning Date
April 2, 2026
Report written date
April 7, 2026
End User
N/A
Number of Tuning Trial
1st
Location
N/A
Equipment
Manufacturer: Thermo Fisher Scientific
Equipment: SEM
Model: Apreo 2S
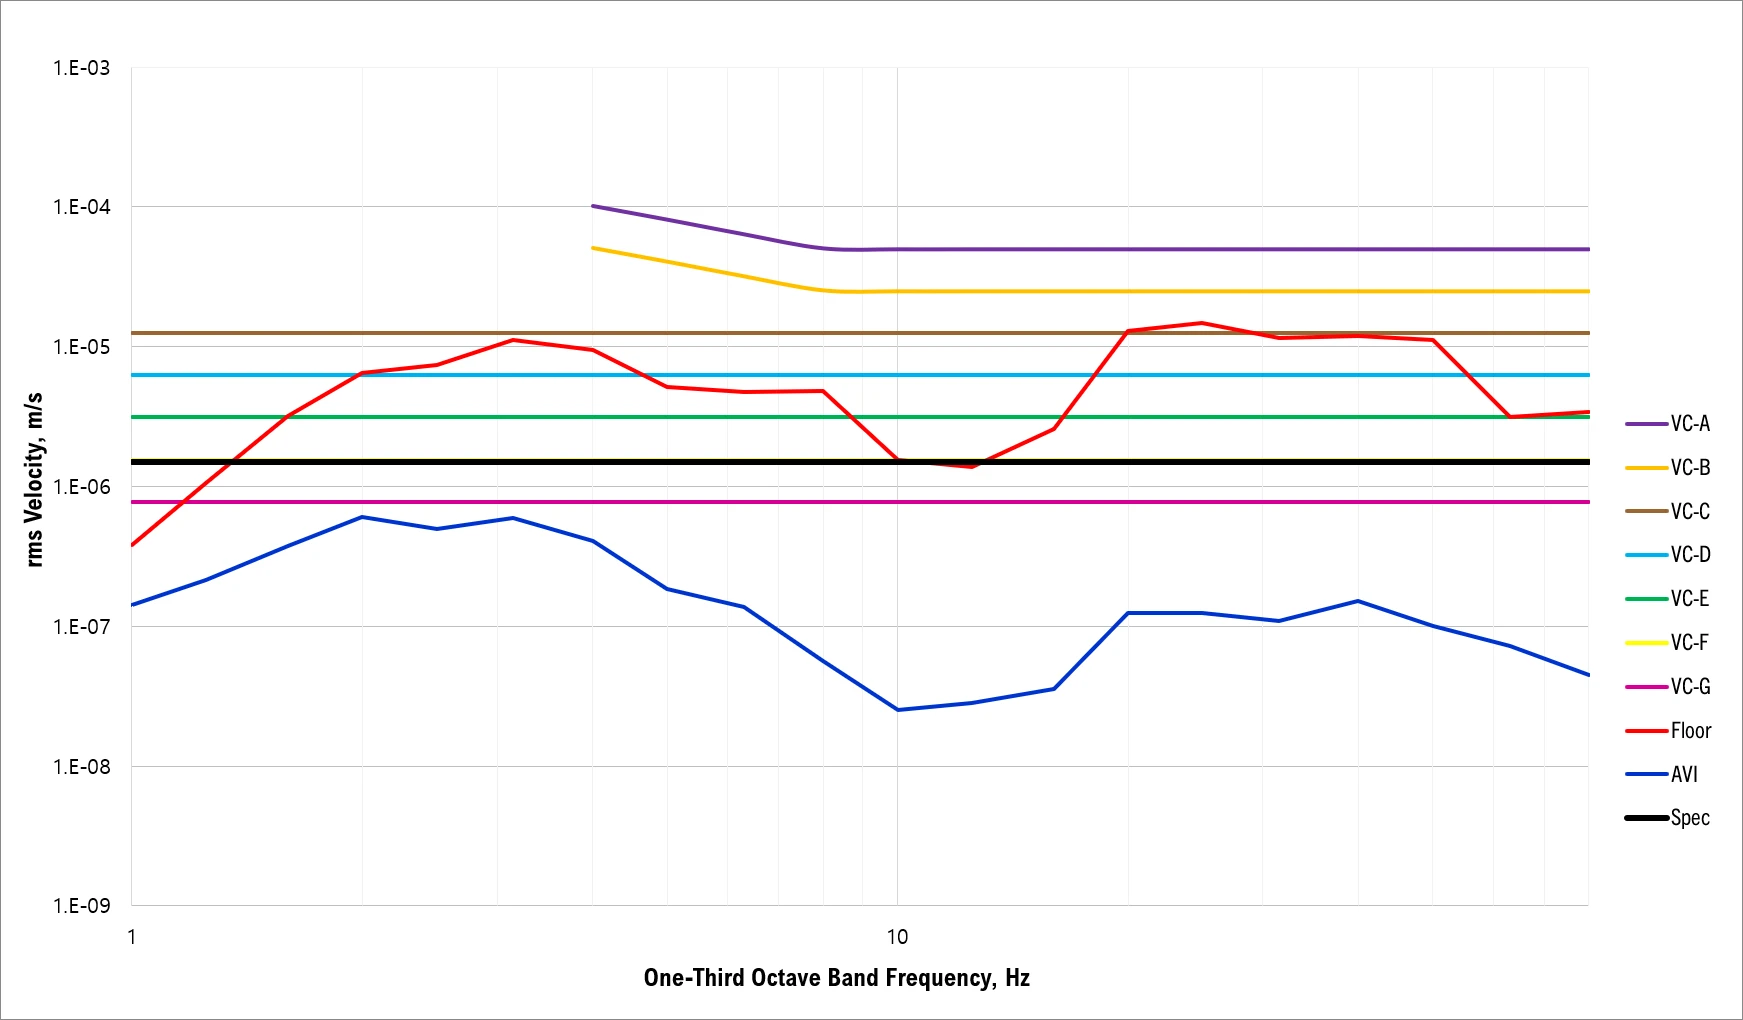
Vibration specification (equipment)
Vibration specification
is shown as a manufacturer / allowable-vibration diagram. The measurement summary uses this as the vibration specification context for the VC levels listed in that summary.
Allowable vibration diagram
Equipment Condition
The equipment is Turned on / IDLE during the reported measurement.
Tuning Request
N/A
Conclusion
At the DVIA-ML1000 (on-isolator) measurement points, results are PASS in this summary for Vertical, Left to Right, and Front to Back at the cited frequencies. Floor points in the same summary are FAIL; use the summary to compare floor and isolator.
Measurement Summary
| Measurement Point | Status | Axis | Vibration specification | Measurement Data | Result | ||
|---|---|---|---|---|---|---|---|
| Floor | DVIA-ML1000 | Floor | DVIA-ML1000 | ||||
| 1. Floor vibration 2. DVIA-ML1000 | Turned on / IDLE | Vertical | VC-G | VC-C @ 25 Hz | VC-G @ 25 Hz | ✗ FAIL | ✓ PASS |
| Left to Right | VC-D | VC-D @ 8 Hz | {blue}VC-G{/red} @ 8 Hz | ✗ FAIL | |||
| Front to Back | VC-E | VC-E @ 3.15 Hz | {blue}VC-G{/red} @ 3.15 Hz | ✗ FAIL | |||
Data and Image
Vertical
(VC Curves, Autospectrum, Transmissibility), then Left to Right, then Front to Back; then Equipment picture below. Autospectrum files use narrow-band in the file name (storage).
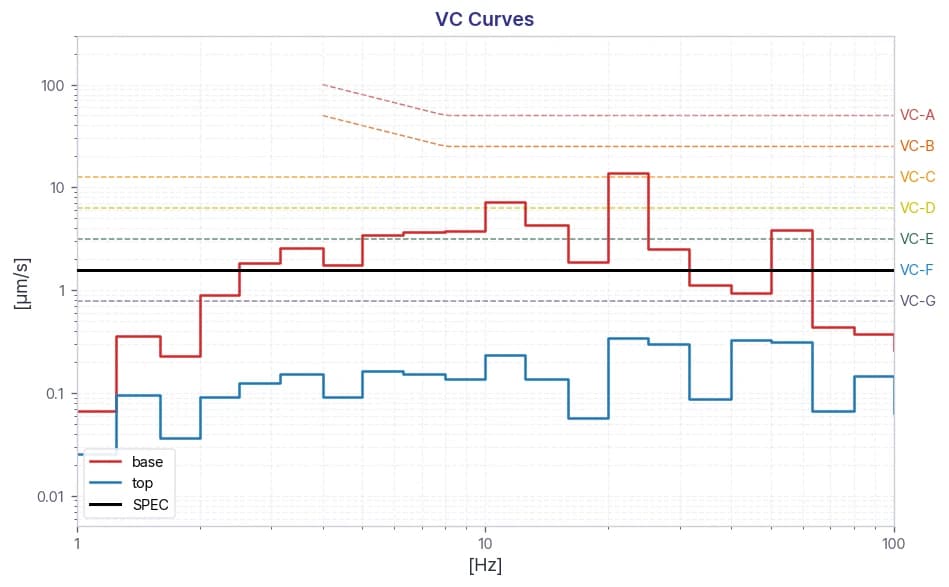
Vertical VC Curves
Vertical Autospectrum
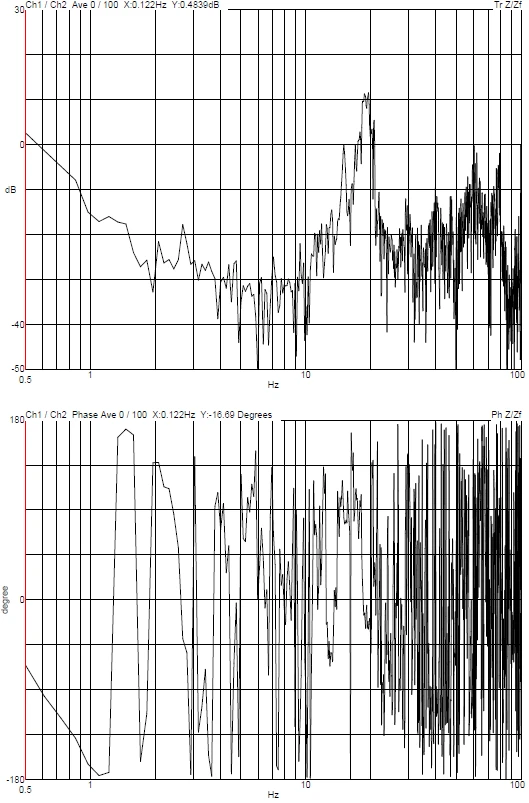
Vertical Transmissibility
Left to Right VC Curves
Left to Right Autospectrum
Left to Right Transmissibility
Front to Back VC Curves
Front to Back Autospectrum
Front to Back Transmissibility
Equipment picture
Reference
Notes:
- As measured in one-third octave bands over 8-80 Hz (VC-A/B) or 1-80 Hz (VC-C through VC-G).
- Detail size refers to width in microelectronics fabrication or particle size in medical research.
Share this Case Study
Case Study Information
Related Case Studies
YIMO TECH Thermo Fisher Scientific Apreo 2S SEM DVIA-ML1000 Installation Report
China Color Innovation Institute Thermo Fisher Scientific Apreo 2S SEM DVIA-ML1000 Installation Report