Case Study
DVIA-T Series
04-11-2022
AFM SILICON CANTILEVER IMAGING
Case Studies
DVIA-T Series
Analysis - Frequency Graph
- X-axis(A-B) voltage measurement of PD on Airtable(Sinking/Floating mode), Bungee-cord, and Active vibration isolator.
- 50kS/s(40ns) sampling rate - FFT is measured up to 25kHz
- Over 1kHz, All substrates have similar noise.
- Under 1kHz, Airtable(Sinking Mode) is the worst.
- Airtable(Floating Mode) and DVIA-T45 is the best.
Analysis - Standard Deviation
- STD is measured for signal noise
- Sinking (0.02763V), Floating (0.00936V), Bungee-cord (0.00856V), and Active(0.00579V).
- DVIA-T45 yields the best performance
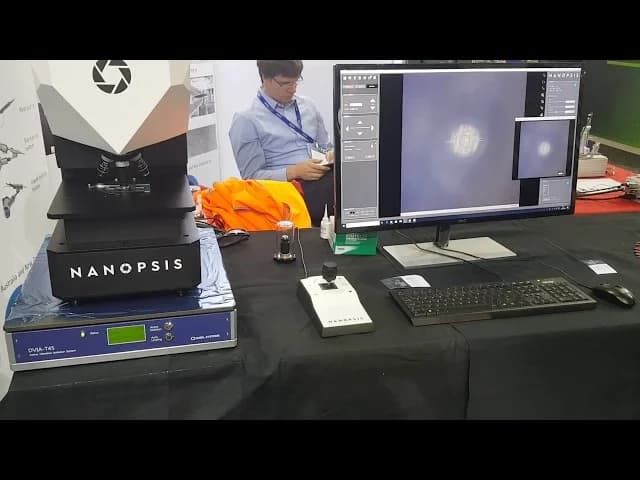
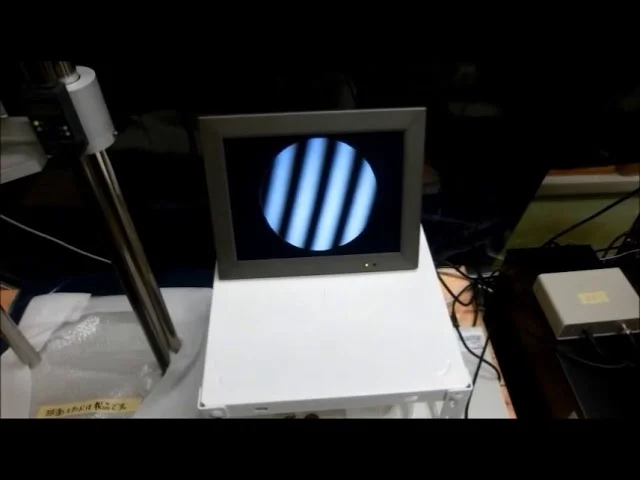
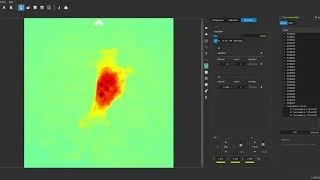
Imaging TEST in Different Substrate (Silicon Cantilever)
Share this Case Study
Case Study Information
Category
Case Study
SeriesDVIA-T Series
Date04-11-2022
Tags
Case Studies
DVIA-T Series